Figure 5.
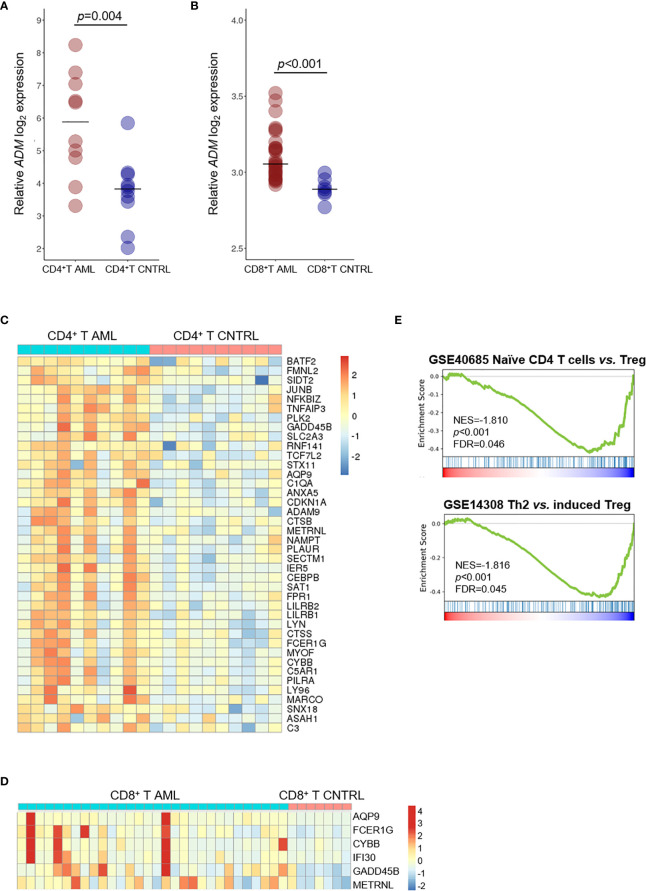
ADM is overexpressed in the T cell compartment of AML patients and associates with a tolerogenic gene signature. (A) Comparison of ADM levels between CD4+ T cells from AML patients and healthy subjects (GSE14924) and (B) between CD8+ T cells from AML patients and healthy subjects (GSE117090). Scatter plots were generated with the R package ggplot2 (48) (version 3.3.1). Each dot indicates one sample and the bar represents the median value (CNTRL: healthy subjects). (C) Heatmap of ADM co-expressed genes that are differentially expressed between CD4+ or (D) CD8+ T lymphocytes isolated from AML patients and from healthy subjects. Columns represent patients/subjects. Data were standardized through a z-score transformation. Color changes within a row indicate expression levels relative to the mean and rescaled on the transcript standard deviation. Genes are grouped according to average linkage hierarchical clustering. Heatmaps were built with R package pheatmap (64) (version 1.0.12). (E) GSEA of CD4+ T cells from AML patients compared with healthy subjects showing the enrichment of tolerance signatures (NES, normalized enrichment score, FDR, false discovery rate; Th2, T-helper 2, Treg, regulatory T cells).

