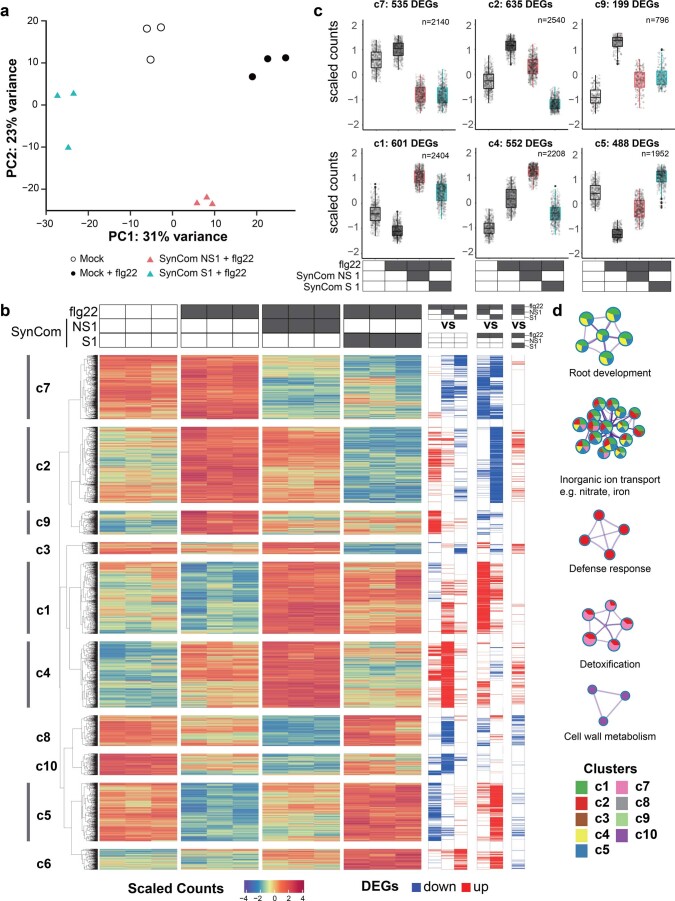
Extended Data Fig. 6. SynCom colonization and flg22 treatment induce global root transcriptomic changes of pWER::FLS2-GFP plants.
a, PCA plot separating samples inoculated with taxonomically similar SynComs (SynCom NS1 and S1) treated with 1 µM flg22. b, Heat map (middle) and DEGs (Supplementary Table 2–4) obtained by pairwise comparison under flg22 treatment (right). k-means clusters (k = 10) with hieratical tree are marked on the left. c, Scaled counts of transcripts in six clusters and their expression patterns upon treatments. n=total number of biological samples collected from three replicates. The box plots centre on the median and extend to the 25th and 75th percentiles, and the whiskers extend to the furthest point within the range of 1.5× the interquartile range. d, A subset of significantly changed GO terms (adjusted p < 0.05) associated with specific clusters. Size of pie charts corresponds to number of DEGs. Linked GO terms indicate shared genes (Jaccard similarity > 0.2).

