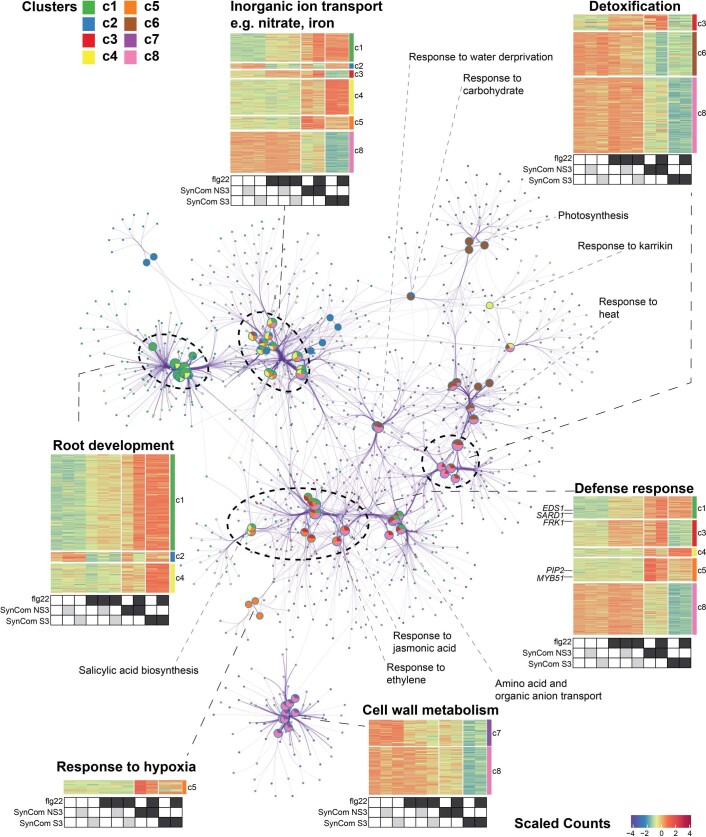
Extended Data Fig. 7. DEG-linked GO network.
Network showing the association of significantly changed biological function GO terms (pie charts; adjusted p < 0.05) with different DEGs (small nodes) obtained by pairwise comparison in Col-0 transcriptome experiments. Size of pie charts corresponds to number of DEGs. Linked GO terms indicate shared genes (Jaccard similarity > 0.2). Closely gathered GO terms form clusters in the network showing similar functions (indicated with dash lines), and heatmaps for GO clusters corresponding to the average scaled counts of transcripts for each treatment are drawn on the sides. The position of clusters is arranged according to topology. Clusters and DEGs correspond to Fig. 3b.

