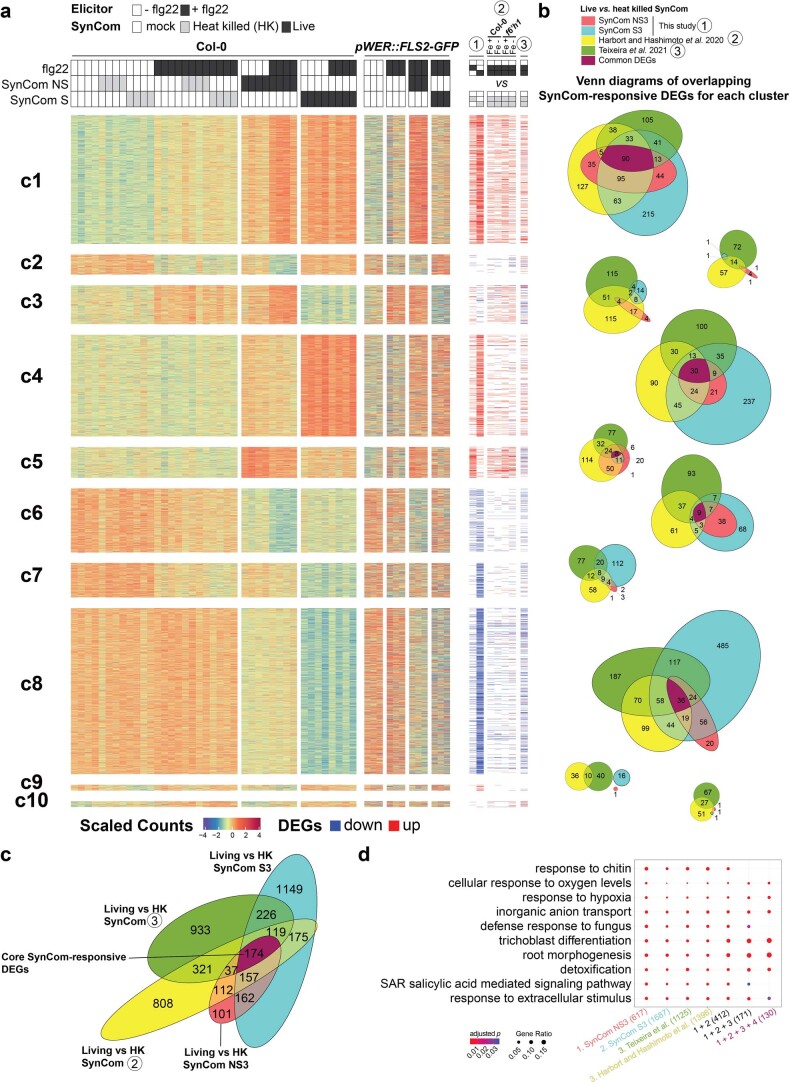
Extended Data Fig. 8. Live SynComs induce common host transcriptomic response.
a, Heat map summarizes the root transcriptomic changes from three independent studies (Supplementary Table 8–12, ①: current study; ②: Harbort and Hashimoto et al., 2020 (ref. 13); ③: Teixeira et al., 2021 (ref. 31)). The data obtained from pWER::FLS2-GFP plants was shown alongside Col-0 dataset indicating conserved trends of gene expression across different genotypes. DEGs were obtained by pairwise comparisons between live and heat-killed (HK) SynCom treatments (adjusted p-value < 0.05 and fold-change > 1.5). The corresponding data extracted from Harbort and Hashimoto et al., 2020 (ref. 13) and Teixeira et al., 2021 (ref. 31) were shown on the right. b, Venn diagrams showing the overlapping SynCom-responsive DEGs (live vs. HK SynComs) of each cluster. Most SynCom-responsive DEGs were found in c1, c4, c5, c6 and c8. c, Venn diagram summarizing the overlap of SynCom-responsive DEGs of these independent studies. The core 174 SynCom-responsive host DEGs were highlighted in purple. d, Enrichment of selected GO terms for the 174 core SynCom-responsive DEGs. Numbers in parentheses indicate the total number of DEGs with GO annotations.

