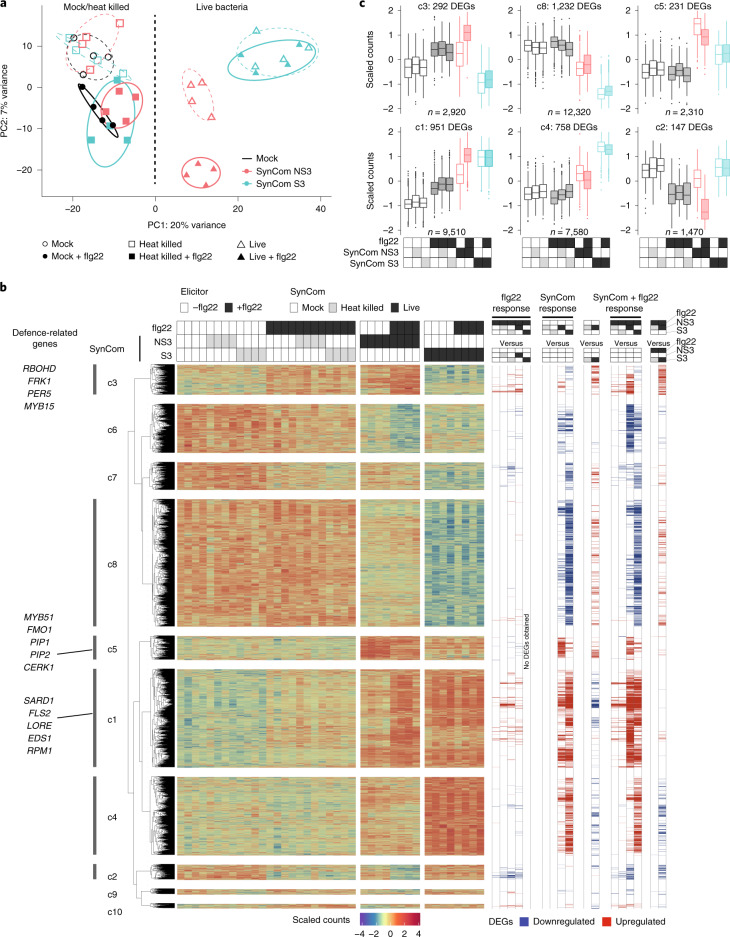
Fig. 3. SynCom colonization and flg22 treatment induce root transcriptomic changes in WT Col-0 plants.
a, PCA plot separating samples inoculated with SynComs and flg22. Ellipses correspond to t-distributions fitted to each cluster (70% confidence interval). b, Heat map (middle) and DEGs (Supplementary Tables 5–7) obtained by pairwise comparison (right). k-means clusters (k = 10) are marked on the left. c, Scaled counts of transcripts in six clusters and their expression patterns after treatments. n values indicate the total number of biological samples collected from four replicates. The corresponding transcriptome data of pWER::FLS2-GFP plants are presented in Extended Data Fig. 6 and Supplementary Tables 2–4. The colours used in a and c match those used in Fig. 2, and correspond to different SynComs. The box plots centre on the median and extend to the 25th and 75th percentiles, and the whiskers extend to the furthest point within 1.5× the interquartile range.

