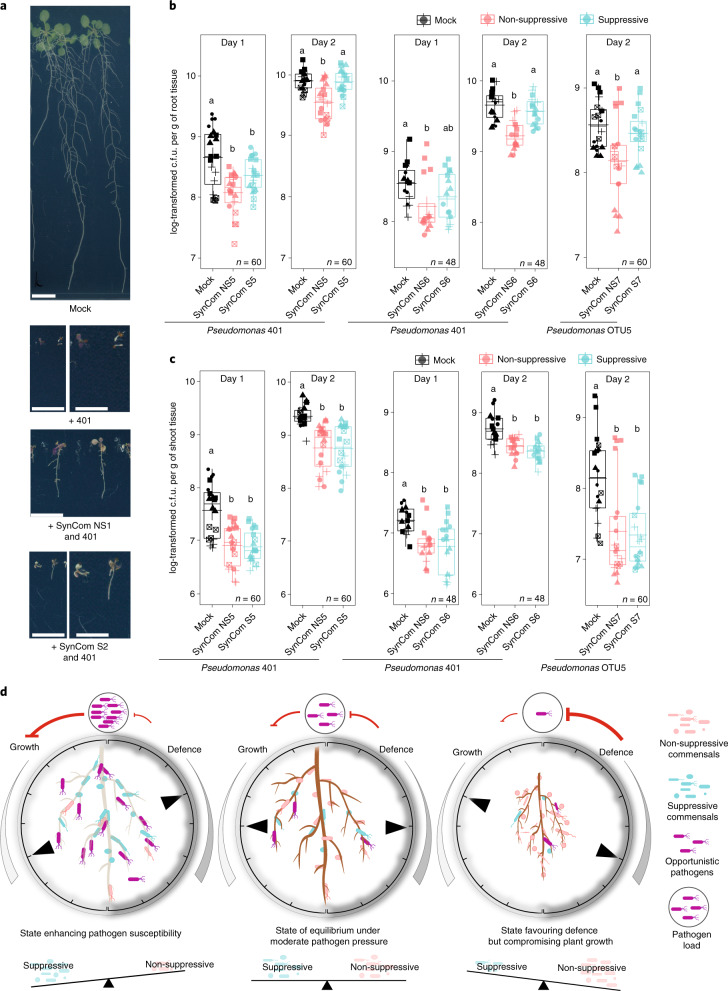
Fig. 4. Imbalance of specific bacteria impacts plant susceptibility to opportunistic Pseudomonas pathogens.
a, Symptoms of WT plants (aged 3 weeks) germinated with the indicated SynCom and Pseudomonas 401. Scale bars, 1 cm (top and third row, and second and fourth row (left)) and 0.5 cm (second and fourth row (right)). b,c, Bacterial titre of Pseudomonas 401 and OTU5 on the roots (b) and shoots (c) of pWER::FLS2-GFP plants that were precolonized with the indicated SynComs for 2 weeks. No flg22 was used in these experiments. The shapes represent five (SynCom NS5 + S5), four (NS6 + S6) and five (NS7 + S7) biological replicates in b. c.f.u., colony-forming units. n values indicate the total number of biological samples. Different letters indicate statistical significance determined using two-sided Dunn’s Kruskal–Wallis test (P < 0.05). The box plots centre on the median and extend to the 25th and 75th percentiles, and the whiskers extend to the furthest point within 1.5× the interquartile range. d, The ‘rheostat model’ proposes that the balance between non-suppressive and suppressive strains integrates with plant innate immunity, and buffers the system against pathogen challenge and defence-associated trade-off.

