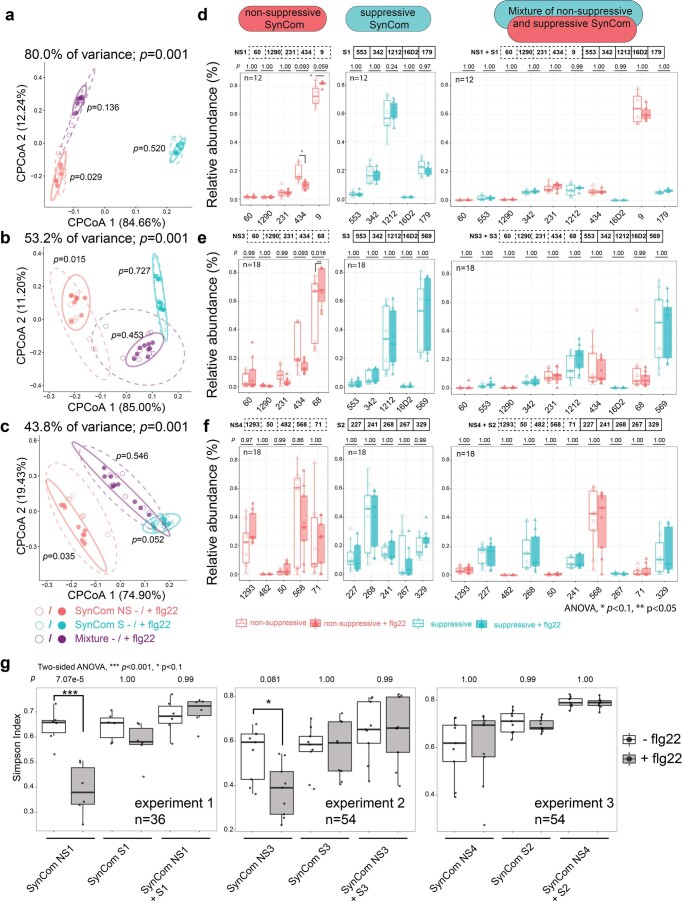
Extended Data Fig. 5. Activation of immunity by flg22 affects community establishment in WT Col-0 plants.
a-c, Constrained coordination of the microbial profile of Col-0 root samples showing the effect of flg22 and SynCom. Ellipses correspond to Gaussian distributions fitted to each cluster (95% confidence interval). p-values next to ellipses indicate statistical significance based on a PERMANOVA test between untreated and flg22-treated samples of each SynCom (permutation = 999, p < 0.05). d-f, Relative abundance of strains upon flg22 treatment. Experiment 1: (a,d); experiment 2: (b,e); experiment 3: (c,f). The corresponding strains used in each SynCom were indicated on top of (d-f). These experiments were conducted using different SynComs and repeated twice with consistent result. Values in bracket are eigenvalues explained by the Principal Component (PC). Colors indicate SynComs used and shapes indicate flg22 treatment. g, Simpson diversity index of the corresponding experiments performed with pWER::FLS2-GFP plants. n=total number of biological samples collected from three biological replicates. Asterisks indicate statistical significance (two-sided ANOVA, p < 0.05) and the p values are provided on top of each graph. The box plots centre on the median and extend to the 25th and 75th percentiles, and the whiskers extend to the furthest point within the range of 1.5× the interquartile range.

