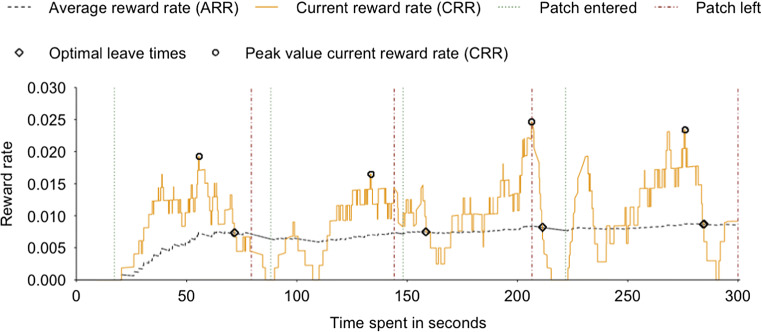
Fig. 2.
ARR/CRR fitting procedure for one specific participant. To approximate optimal foraging behavior (following MVT), we calculated, separately for each participant and each time point, the current reward rate (CRR) and average reward rate (ARR) of the environment. Instances where the CRR and ARR intersect after a peak in the CRR signal is detected (displayed as circles) reflect optimal leave times (OLTs; displayed as diamonds). These time points were compared with participants’ actual leave times (i.e., ALTs; vertical red lines), which defined the leave time difference (LTD) parameter

