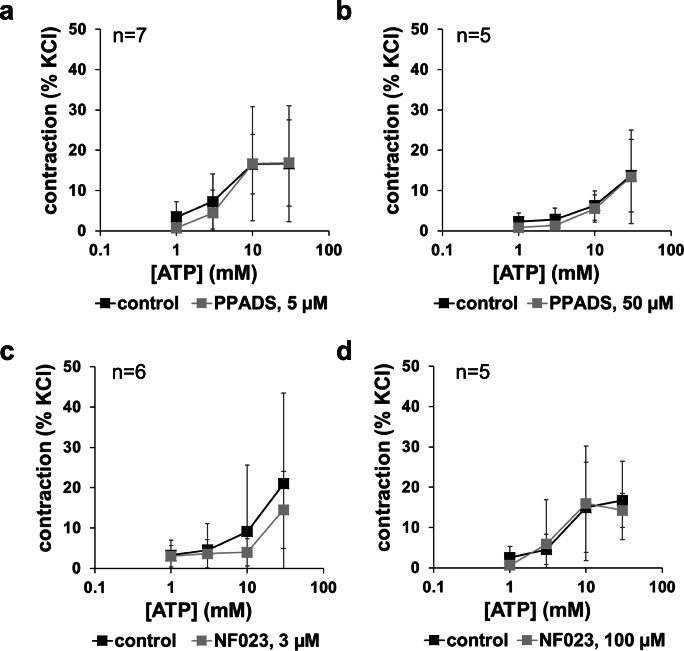
Fig. 2.
Concentration-dependent contractions by ATP disodium salt, and effects of NF023 (3 μM, 100 μM) and PPADS (5 μM, 50 μM) in human prostate tissues. Construction of concentration response curves was started 30 min following administration of antagonists, or of an equivalent amount of water (solvent) in controls. Shown are means ± SD from four independent series, each with prostate tissues from n = 7 (a), n = 5 (b), n = 6 (c), and n = 5 (d) different patients, where tissue from each prostate was allocated to the control and antagonist groups in each single experiment

