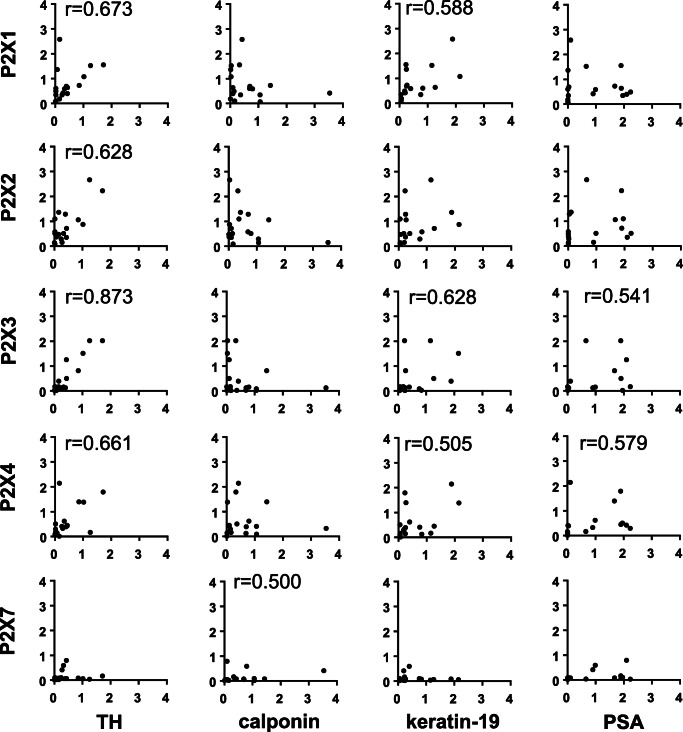
Fig. 8.
Spearman’s correlation analyses were performed by between mRNA expression of all examined P2X subtypes, and markers (tyrosine hydroxylase (TH) for catecholaminergic nerves, calponin-1 for smooth muscle, cytokeratin-19 for glandular epithelial cells, PSA for degree of BPH). Diagrams only include values not exceeding 4 (all values are relative 2−ΔCt), to realize visual presentation of correlations in addition to r values. All values for P2X receptors, including those > 4, are shown in Fig. 7a. Indicated r values refer to complete data sets, including values > 4

