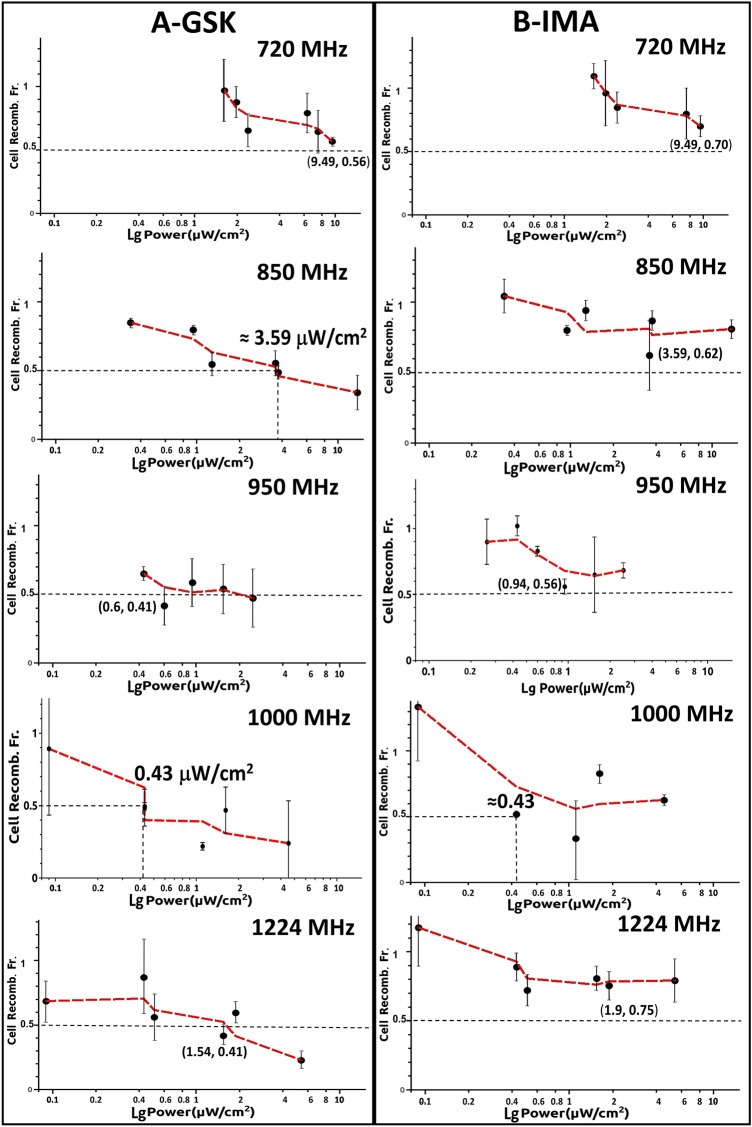
Figure 4.
The EMF power dose-cell recombination response curves at 720, 850, 950, 1000 and 1224 MHz for both types of pharmacological agents stimulating RAG expression (A) (GSK-690693, GSK), and (B) (Imatinib, IMA). Cell Recomb. Fr. expresses the ratio values of measured Vk-Jk2 recombination quantified from cells grown in + EMF/-EMF (irradiated/non-exposed) conditions. Bottom abscissa displays logarithm of S power flux density values (Power µW/cm2) measured around the emitting antenna inside the CO2 5 vol%, and 95% water humidity incubator air conditions, expressed as a single range in all panels(logartithmic scale). The black dotted line denote a level of EMF induced two-fold recombination reduction (Cell recomb. Fr. = 0.5), whereas when this level is not reached in the experiment the coordinates of the lowest obtained Cell Recomb. Fr. are given. The red dotted line connecting markers is just a Moving Window Average line which accounts for the average between successive data points displaying the trend of data variation. The error bars represent standard deviation (SD) values from three independent experiments.

