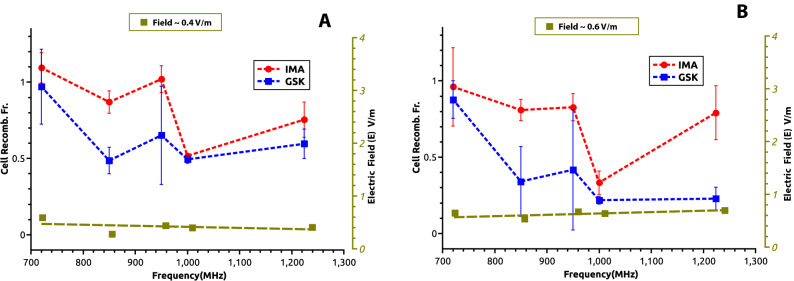
Figure 5.
Variation of cell recombination fraction (+ EMF/-EMF) with the field irradiation frequency shown in each panel for a constant receiver EMF electric intensity field E calculated in the cell culture medium. (A) EMF electric field intensity E 0.4 V/m, (B) EMF electric field intensity E 0.6 V/m. The pharmacological agents stimulating RAG expression GSK-690693, GSK-blue, and Imatinib, IMA-red. The pale green dotted line shows the relative constant distribution of measured electric field as a function of frequency. The error bars represent standard deviation (SD) values from three independent experiments.

