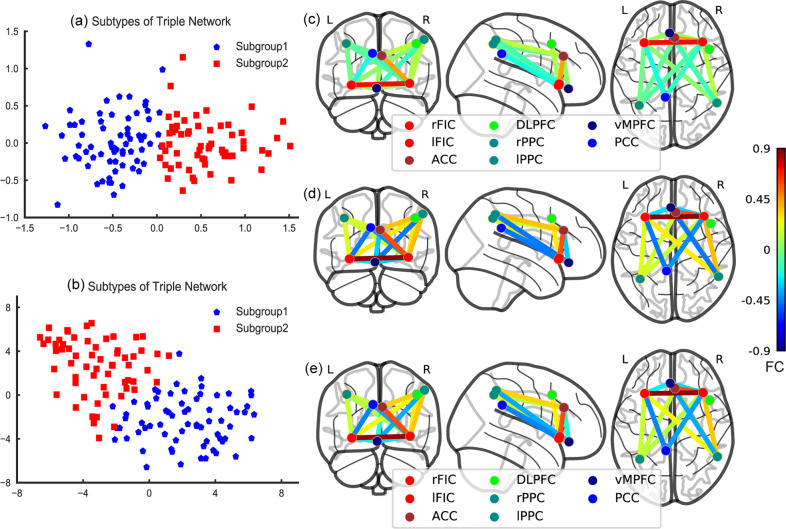
Fig. 1. Triple-network pattern-based FES subgroups in the discovery dataset.
a Clusters are plotted using PCA in the discovery dataset. Two-dimensional principal subspace for patient subgroups. The X-axis represents the value of the first principal component that accounts for the largest possible variance in the dataset. The Y-axis represents the value of the second principal component. b Clusters are plotted using t-SNE. Two-dimensional embedded subspace for patient subgroups. The X-axis represents the value of the first embedded space by t-SNE. The Y-axis represents the value of the second embedded space. c Subgroup 1. d Subgroup 2. e Healthy controls. L left, R, right. The colorbar represents FC values. ACC anterior cingulate cortex, FIC fronto-insular cortex, DLPFC dorsolateral prefrontal cortex, PPC posterior parietal cortex, vMPFC ventromedial prefrontal cortex, PCC posterior cingulate cortex.

