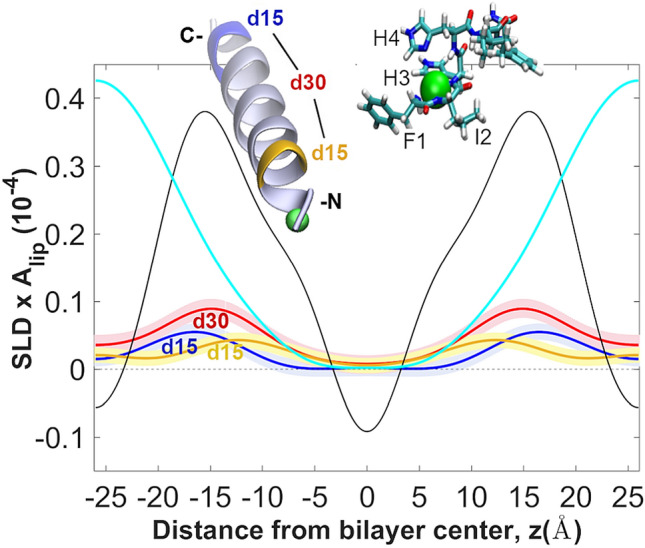
Figure 6.

Positioning of P3-Cu2+ in the bilayer with ND and deuterium contrast. The SLD profiles of two groups of specifically deuterated amino acids near the N-terminus (I5d10F6d5; yellow) and C-terminus (F19d5L20d10; blue) of P3 were obtained, as well as their sum (red) (Methods). Each profile represents time and ensemble averages of each of deuterated groups in the thermally disordered bilayer. The overall profiles for the neat POPC bilayer with P3-Cu2+ (black) and the water distribution (blue) are overlaid on those for the deuterated groups. Measurements were done at P/L = 1:25, 23 °C, and 93% relative humidity. Uncertainty bands in the deuterium profiles (colored bands) were determined using a 68% confidence interval in the Monte-Carlo sampling of the measured structure factors87. The inset show representative average conformation of the P3 α-helix in the bilayer, using a 3D structure derived from the NMR structure (PDB ID # 6PEZ)58 and the predicted structure of the Cu2+-bound ATCUN motif based on density functional theory calculations64. The orientation of the α-helix in the bilayer is derived from the diffraction SLD profiles. The two deuterated sites are shown with yellow and blue; the Cu2+ ion (green sphere) is shown at a larger than true scale for better visibility.
