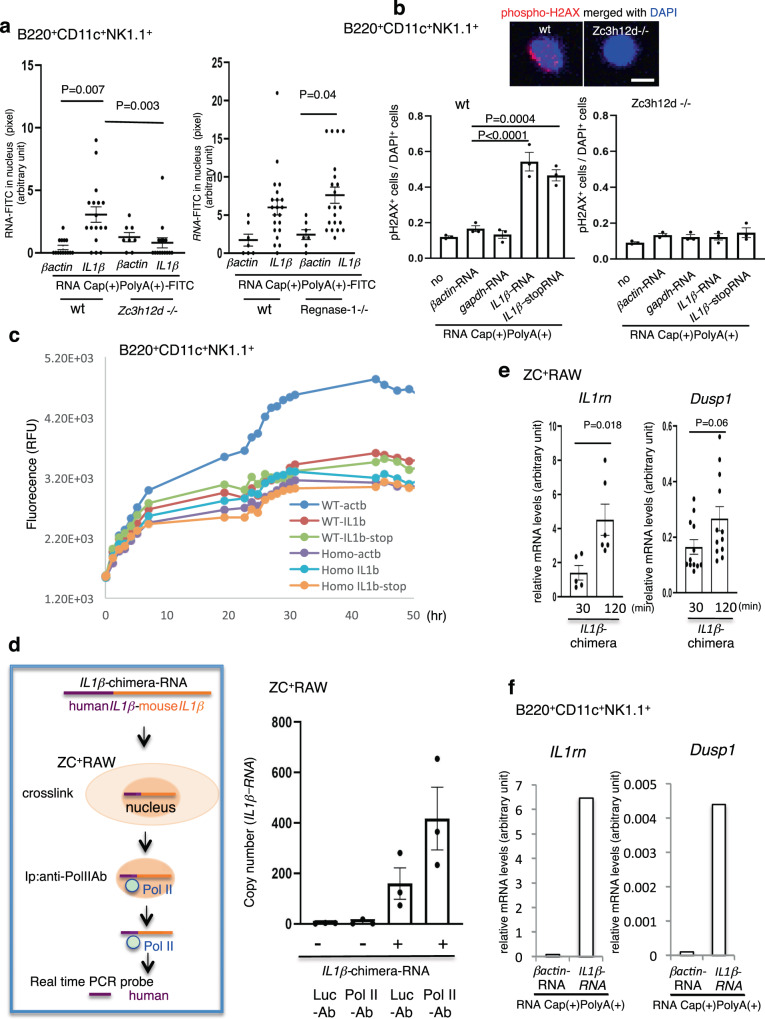
Fig. 5. nex-IL1β-mRNA induces biology in the ZC3H12D+NK nucleus.
a RNA uptake in B220+CD11c+NK1.1+ cells derived from wild-type, Zc3h12d–/–, and Regnase-1–/– (Zc3h12a–/–) mice 3 h after the application of 10 ng/mL βactin-mRNA-CP-FITC and IL1β-mRNA-CP-FITC. The quantifications of the FITC signal in B220+CD11c+NK1.1+ cell nucleus are shown (left, n = 14, 17, 8, and 15 cells from wild-type and Zc3h12d–/– mice for βactin-RNA and IL1β-RNA, respectively. right, n = 7, 21, 7, and 21 cells from wild-type and Regnase-1–/– mice for βactin-RNA and IL1β-RNA, respectively; 15 z-stack images per cell). Ages of Regnase-1–/– mice were close to Zc3h12d–/– mice. b Representative immunostaining for phospho-H2AX in the nucleus of B220+CD11c+NK1.1+ cells 3 h after the uptake of IL1β-mRNA-CP (top). Quantitative analysis of phospho-H2AX in B220+CD11c+NK1.1+ cells derived from wild-type and Zc3h12d–/– mice 3 h after the uptake of βactin-mRNA-CP gapdh-mRNA-CP IL1β-mRNA-CP and IL1β-stop-mRNA-CP (n = 3 biologically independent samples). Bar, 5 μm. c Time course of secondary necrosis in B220+CD11c+NK1.1+ cells derived from TCM-stimulated wild-type and Zc3h12d–/– (Homo) mice in the application of 20 ng/mL RNA. βactin-mRNA-CP, IL1β-mRNA-CP, and IL1β-stop-mRNA-CP were depicted as actb, IL1b, and IL1b-stop, respectively. Real-time tracking of fluorescein-DNA dye indicates the loss of membrane integrity resulting in late-stage apoptosis. d Detection system of entrained ex-IL1β-mRNA bound to Pol II in ZC+RAW cells (left). Real-time PCR analysis of IL1β-chimera-mRNA associated with Pol II in the nucleus. Anti-luciferase (Luc) antibody is the control (n = 3 biologically independent samples). e qPCR-derived quantifications of IL1rn and Dusp1 expression in nuclear RNA of ZC+RAW after application of IL1β-chimera-mRNA (n = 5 and 6 biologically independent samples at 30 and 120 min, and n = 12 biologically independent samples at 30 and 120 min for IL1rn and Dusp1, respectively). f qPCR-derived quantifications of IL1rn and Dusp1 expression in B220+CD11c+NK1.1+ cells after the application of βactin-mRNA and IL1β-mRNA. Representative data are shown in the graph. Repeated experiment data are shown in Supplementary Fig. S9. In the graphs, averages ± SEM and the results of Student’s t-test (two-sided) or one-way ANOVA with Bonferroni correction are shown. The P values are shown in the figure. Source data are provided as a Source Data file.

