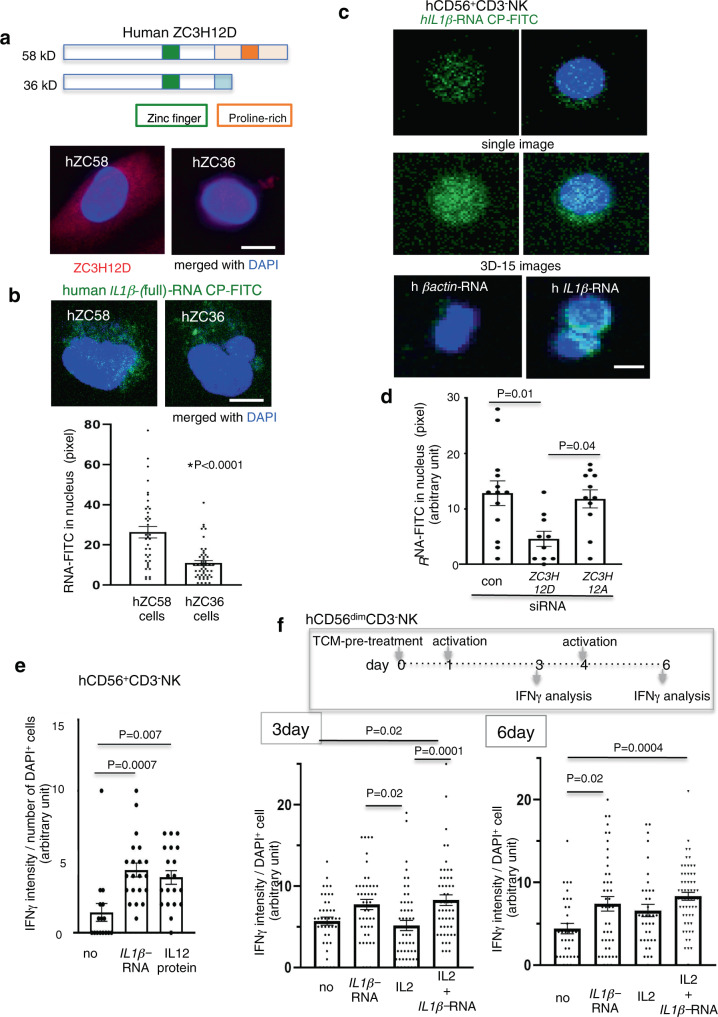
Fig. 7. hZC3H12D contributes to the uptake of nex-hIL1β-mRNA with function.
a Scheme for two splicing isoforms of hZC3H12D. The long and short forms encode 58 and 36 kDa proteins, respectively. Both have a common N-terminal sequence, including a ZF domain (green), and the long form has a proline-rich domain (orange; top). IHC analysis of ZC3H12D in the long form (hZC58)- and short form (hZC36)-overexpressing 786-O cells (bottom). Experiments were repeated twice with similar results. b Representative confocal microscopy images of hIL1β-mRNA-FITC uptake in the hZC58 or hZC36 cell nucleus (top). Quantitative signals of hIL1β-mRNA-FITC in the hZC58 or hZC36 cell nucleus (bottom; 3D images per group: n = 38 for hZC58 and n = 50 for hZC36). c Uptake of hIL1β-mRNA-FITC into CD56+CD3-NK cell nucleus 3 h after applying 50 ng/mL RNA with 200 U/mL IL-2 protein. Confocal microscopy imaging showing the DAPI-stained nucleus in single images (top) and 3D stacks combining 15 images from top to bottom (middle). 3D stack images show a comparison of nuclear uptake between hIL1β-mRNA and hβactin-mRNA (bottom). d Nuclear signals of hIL1β-mRNA-FITC in CD56+CD3-NK cells treated with siRNA. Control (con) is a nontargeting siRNA (n = 13, 10, and 11 cells for control, ZC3H12D-siRNA and ZC3H12A-siRNA, respectively. Each cell image is composed of 15-stacked 3D images). e IHC analysis of IFN-γ induction 48 h after RNA application with 200 U/mL IL2 to CD56+CD3-NK cells. The positive control was incubated with 20 ng/mL IL12 protein in an IL2 culture medium (IFN-γ signals from n = 16, 21, and 20 ZC3H12D+ cells for no, IL1β-RNA, and IL2 protein, respectively). f IHC analysis of IFN-γ induction 3 and 6 days after stimulation of hIL1β-mRNA and IL2 protein for MDAMB231-TCM-pretreated CD56dimCD3-NK cells. The assay system is shown (top). Two donor NK cells were independently used. no, control basal culture medium (bottom left, n = 42, 45, 51, and 51 cells for no, IL1β-RNA, and IL2 protein, and IL1β-RNA plus IL2 protein, respectively. Bottom right, n = 34, 44, 37, and 60 cells for no, IL1β-RNA, and IL2 protein, and IL1β-RNA plus IL2 protein, respectively). Bars, 5 μm. In the graphs, the averages ± SEM, and the results of Student’s t-tests (two-sided) or one-way ANOVA with Bonferroni correction are shown. The P values are shown in the figure. Source data are provided as a Source Data file.

