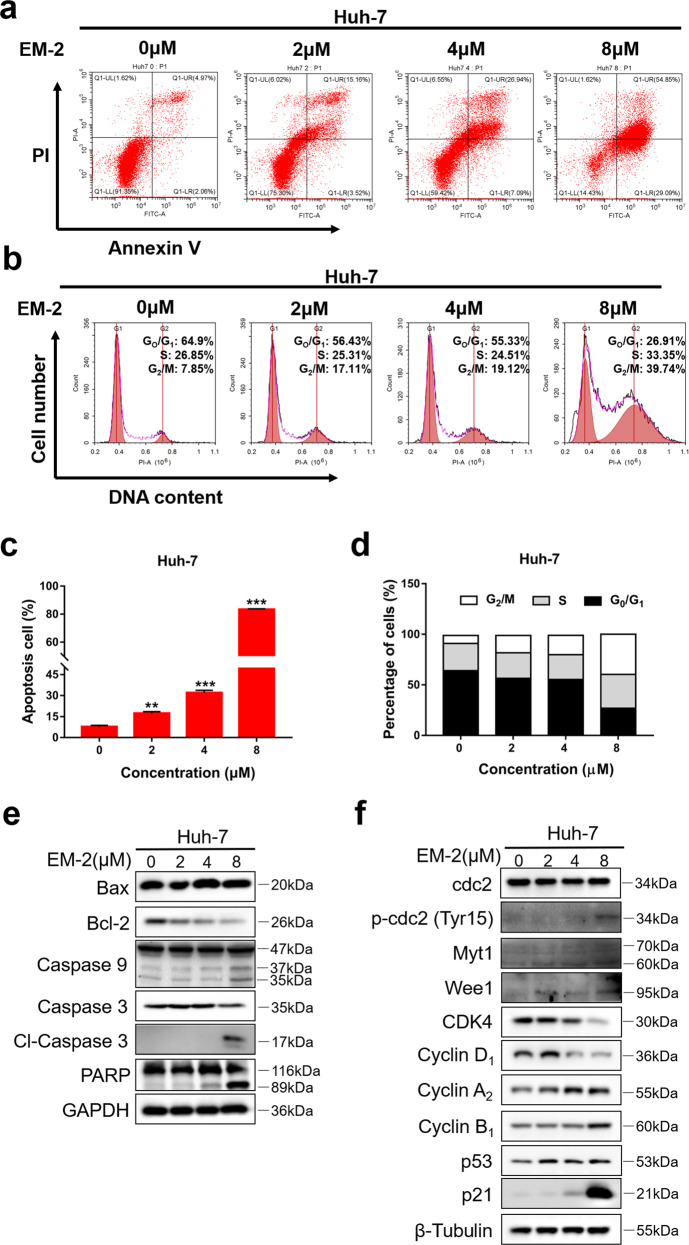
Fig. 3. EM-2 induced G2/M arrest and apoptosis in Huh-7 hepatoma cells.
a Huh-7 cells were exposed to EM-2 (0, 2, 4, and 8 μM) for 48 h, and Annexin V-FITC/PI staining analysis was conducted to evaluate the percentage of apoptotic cells using flow cytometry. b Huh-7 cells were exposed to EM-2 (0, 2, 4, and 8 μM) for 24 h, and PI staining analysis was conducted to analyze the cell cycle distribution using flow cytometry. c, d The percentage of apoptotic cells and cell cycle distribution fractions of Huh-7 cells are displayed as the mean ± standard deviation of triplicate determinations (** compared with control group, P < 0.01; *** compared with control group, P < 0.001). e, f Huh-7 cells were exposed to 0, 2, 4, or 8 μM EM-2 for 24 h. The protein expression levels of genes associated with apoptosis and the cell cycle were analyzed by Western blot analysis. Representative immunoblot of an experiment repeated three times is shown.

