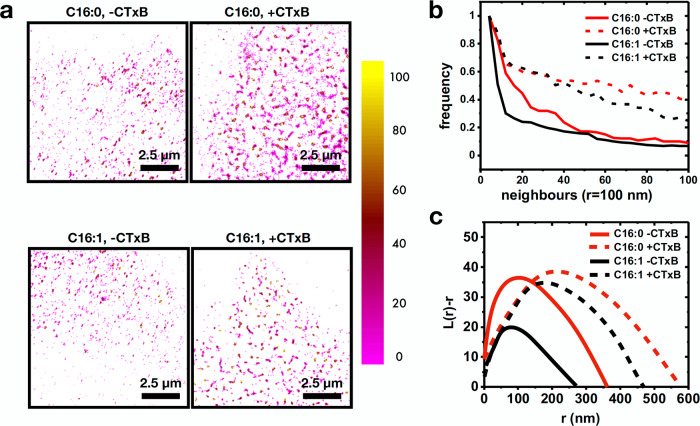
Fig. 4. STORM analysis of Alexa488-GM1 clustering.
a Density maps of Alexa488-GM1 C16:0 (top) and Alexa488-GM1 C16:1 (bottom) in the absence (left) and presence (right) of CTxB. The colormap represents the number of neighbors. b Density plots of frequency of occurrence against number of neighbors for Alexa488-GM1 C16:0 (red) and Alexa488-GM1 C16:1 (black) in the presence (dashed) or absence (solid) of CTxB. c Ripley’s k-function analysis of distributions of Alexa488-GM1 C16:0 (red) and Alexa488-GM1 C16:1 (black) in the presence (dashed) or absence (solid) of CTxB. For b and c, n = 12 cells from 3 independent experiments.

