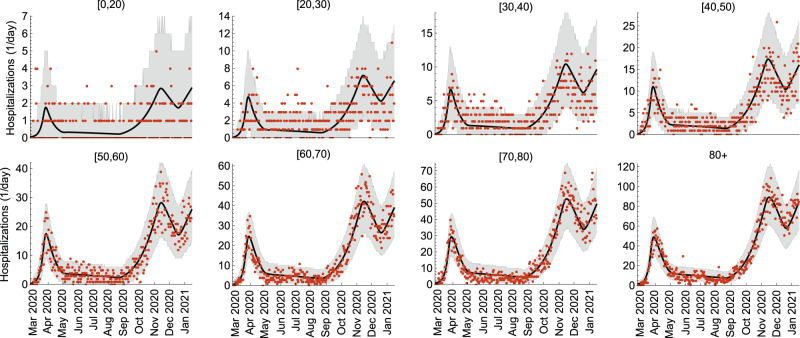
Fig. 1. Model fit to COVID-19 hospitalizations.
The age-stratified daily hospital admission data are shown as red dots. The median trajectories estimated from the model are shown as the black lines. The gray shaded regions correspond to 95% Bayesian prediction intervals based on 2000 parameter samples from the posterior distribution. Hospital admissions were estimated for 10 age groups (see Methods). For presentation purposes, we grouped hospitalizations for ages [0,5), [5,10), [10,20) into the group of [0,20), so only 8 age groups are shown in this figure.

