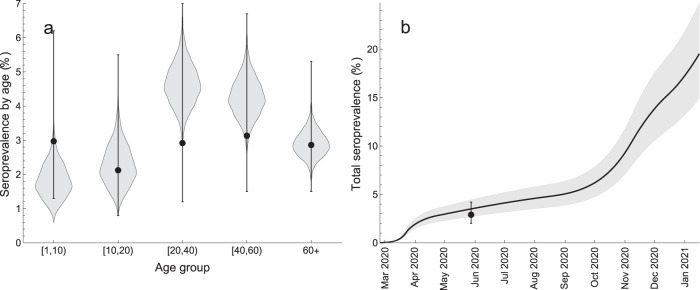
Fig. 2. Model fit to SARS-CoV-2 seroprevalence.
a Age-specific seroprevalence. The violin shapes represent the marginal posterior distribution of the age-specific seroprevalence in the model. b Total seroprevalence. The black line and the gray shaded region show the median total seroprevalence and 95% credible intervals. The uncertainty in the model is based on 2000 parameter samples from the posterior distribution. The data (dots - percentage seroprevalence and error bars - 95% confidence intervals) in a and b are taken from the cross-sectional seroepidemiological survey (First National Serological Survey) conducted after the first pandemic wave59 and supplied in the Mathematica notebook available in the GitHub repository, https://github.com/lynxgav/COVID19-vaccination57. The total seroprevalence refers to population older than 1 year59.

