
Fig. 3. Estimated contact rate and effective reproduction number.
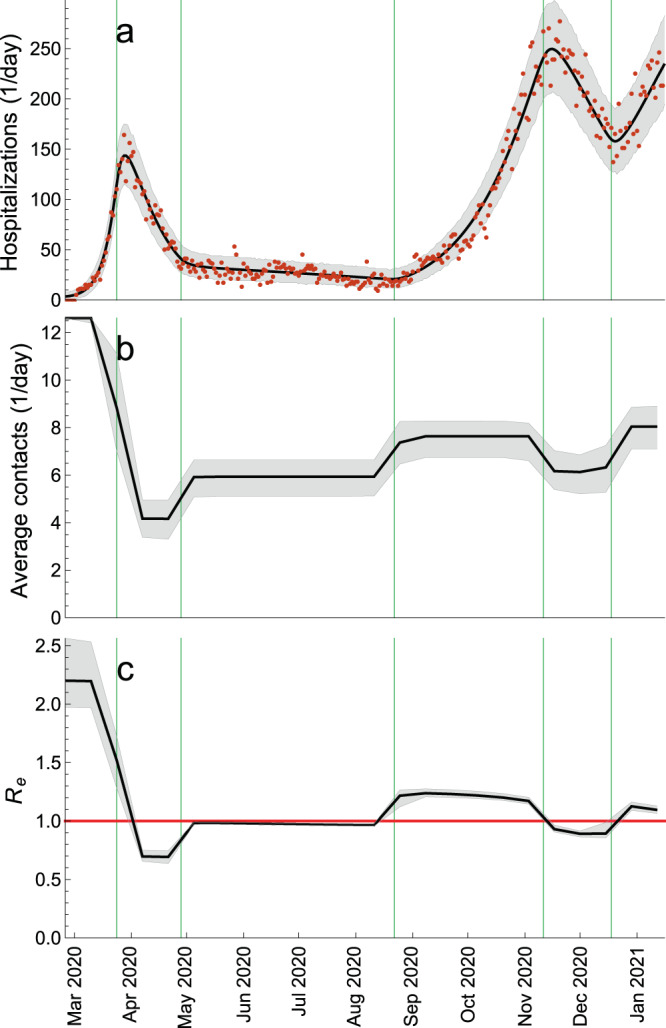
a Total daily hospital admissions with COVID-19. b Average (over all ages) number of daily contacts in the population. c Effective reproduction number, Re(t). The average daily contacts and Re were evaluated once every two weeks. The green vertical lines indicate the estimated mid-point transitions in the age-specific contact rates. The red horizontal line denotes Re = 1. The hospitalization data are shown as red dots. The black solid lines are the median trajectories estimated from the model. The gray shaded regions correspond to 95% credible intervals.