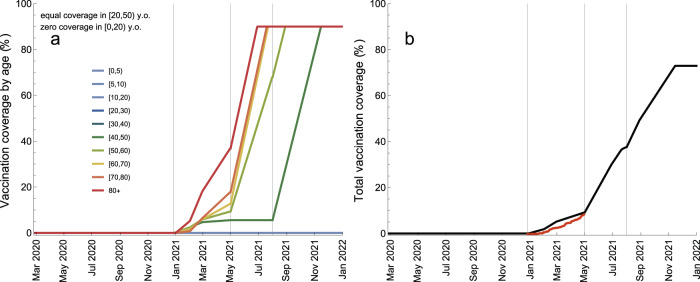
Fig. 5. Vaccination coverage during the vaccination rollout.
a Age-specific coverage (percentage of vaccinated persons per age group). b Total vaccination coverage (percentage of vaccinated persons in the population). The gray vertical lines indicate the starting dates for different vaccination phases (Table 1). The coverages for ages [20,30), [30,40), and [40,50) are equal (see Supplementary Fig. 4 for the absolute numbers of vaccinated persons). The coverage for ages [0,20) is zero. The vaccination rollout data based on fully vaccinated persons1 are shown in b as red dots.

