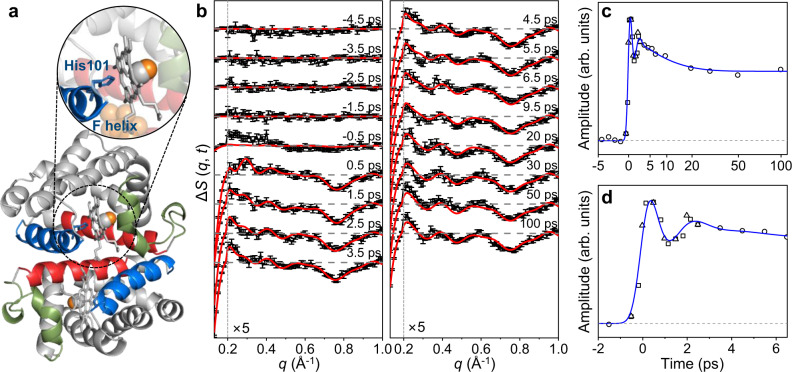
Fig. 1. TRXSS data of HbI and temporal oscillation of the signal.
a A crystal structure of HbI(CO)2 (bottom) and an enlarged view of the heme group and the His101 residue (top) (PDB entry: 3sdh). The C helix with the CD loop, the E helix, and the F helix are indicated with green, red, and blue colors, respectively. The CO ligand molecules are indicated with spheres. The photodissociation of a ligand molecule that is bound to a heme group induces the structural transition of the heme and the overall protein, called the R-T transition. b The experimental femtosecond TRXSS data (black) and calculated curves (red) from −4.5 to 100 ps. The calculated curve at each time delay shown in red was generated by taking a linear combination of the theoretical difference scattering curves of the reaction intermediates (I0, I1, I0U, and I0D) obtained from the structural refinement. For each species, the scattering curves of the candidate structures obtained from structure refinement were averaged to generate the corresponding theoretical difference scattering curve (see the Supplementary Information for detailed information). The coefficients for the linear combination were determined by the concentrations of the reaction intermediates at each time delay. For clarity, the high q region with q ≥ 0.2 Å−1 is scaled up by 5. c, d The first rSVs multiplied by their singular values obtained from the SVD results of the 333-fs-binned data (square), 500-fs-binned data (triangle), and 1-ps-binned data (circle) are plotted for c the full and d early time domains (<6.5 ps). The first rSVs multiplied by their singular values were fitted with a kinetic function convoluted with an instrument response function with 800-fs FWHM. The fit kinetic function (blue curve) consists of an exponential decay function with a time constant of 8.7 ps (±0.6) and a damped cosine function with a damping time constant of 800 fs (±100) and a wavenumber of 13 cm−1 (±1).

