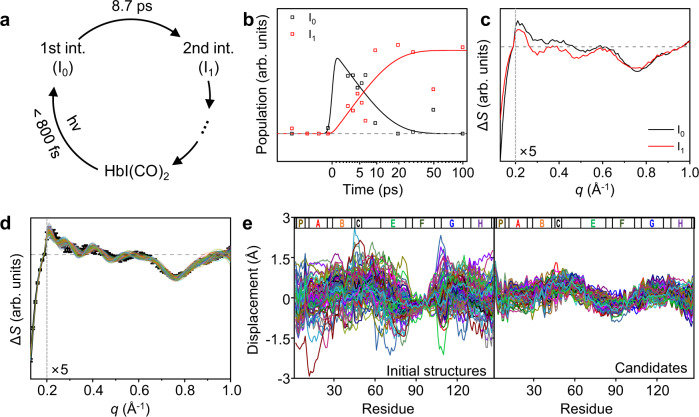
Fig. 2. Kinetic analysis and structure refinement for intermediates of HbI.
a A kinetic model for the initial response of HbI(CO)2 upon photoexcitation. The first reaction intermediate (I0) forms within the instrument response function (800 fs) and transforms into the second reaction intermediate (I1) with a time constant of 8.7 ps. b Relative population profiles of I0 and I1 calculated based on the sequential kinetic model (black and red lines). Optimized populations of each reaction intermediate at each time delay are marked with open squares. c SADSs of I0 and I1. The SADSs were calculated by taking a linear combination of the first and second left singular vectors (lSVs) of SVD results. For clarity, the high q region with q ≥ 0.2 Å−1 is scaled up by 5. d The SADS of I0 (black) and the theoretical difference scattering curves of 108 candidates (other colors). For clarity, the high q region with q ≥ 0.2 Å−1 is scaled up by 5. e Displacement plots of initial structures used for the ERRB structure refinement aided by MC simulations (left) and candidate structures obtained from the structure refinement (right). For each subunit, the displacement was calculated as the changes in the distance from the iron atom to the Cα atom of each residue with respect to the carboxy structure. The displacements of the same residues in the two subunits were averaged. For the displacement plots of the initial structures, 108 initial structures were selected randomly out of the total 270 initial structures used for the structure refinement. The labels of the helices are shown at the top of the plots. The helix labels follow the helix identification in the carboxy structure (PDB entry: 3sdh).

