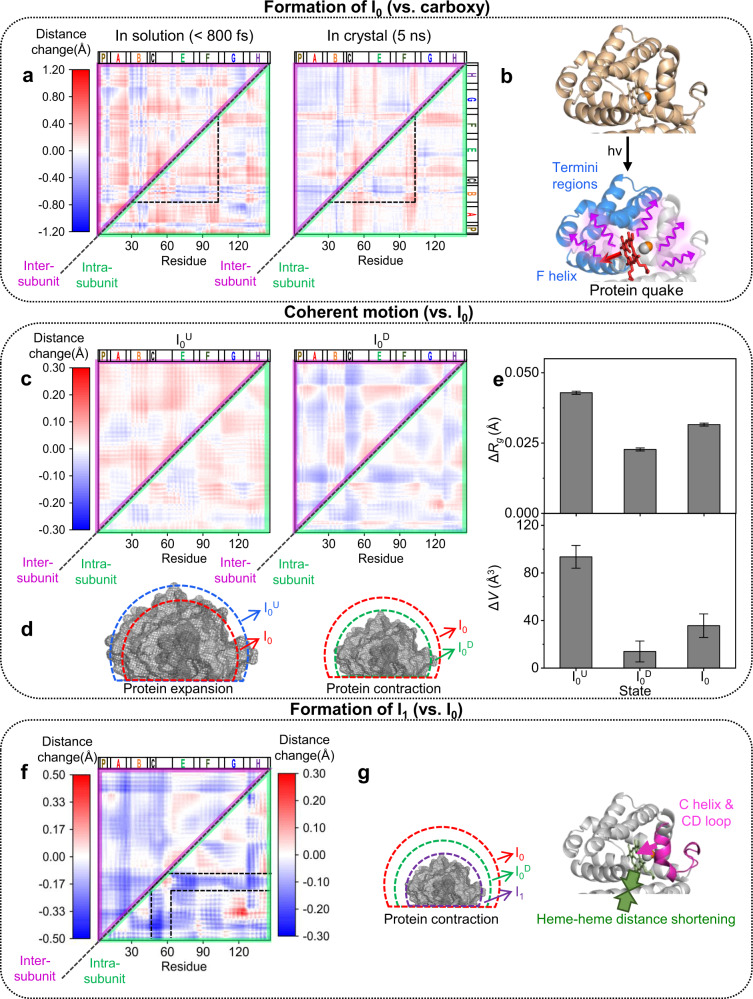
Fig. 3. Ultrafast structural dynamics of HbI obtained from the analysis of TRXSS data in the WAXS region.
a Averaged difference distance maps (DDMs) of I0 (left) and the crystal structure at 5 ns after photolysis (right, PDB entry: 2grz). The carboxy structure (PDB entry: 3sdh) was used as the reference structure. The upper triangle and the lower triangle of the DDM are inter-subunit and intra-subunit DDMs, respectively. Two DDMs are shown in the same scale. The region from the B helix to the F helix where the intra-subunit structural changes in the solution phase and the crystalline phase are similar is indicated by dashed lines. b A schematic figure for the protein quake. The F helix, the C-terminus, and the N-terminus are indicated with blue color, and the heme group is indicated with red color. The red and purple arrows indicate structural deformation propagation from the heme group to the nearby helices such as the F helix and from the nearby helices to the entire protein including the termini regions, respectively. c Averaged DDMs of I0U and I0D. I0 was used as the reference. Two DDMs are shown in the same scale. d Schematics for the expansion and contraction of HbI. The volumes of I0, I0U, and I0D are indicated with red, blue, and green dashed lines, respectively. The volumes of HbI after volume change are indicated by gray meshes. e The difference of radius of gyrations (ΔRg) and volumes (ΔV) of the candidate structures of I0U, I0D, and I0. All differences were calculated with respect to the carboxy structure. Data is presented as mean values ± SEM. The number of candidate structures used for the analysis were 108, 95, and 94 for I0, I0U, and I0D, respectively. f Averaged DDM of I1. I0 was used as the reference. The color gradient for the inter-subunit DDM is shown on the left and that for the intra-subunit DDM is shown on the right. The C helix and CD loop regions that show large movement are indicated by dashed lines. g Schematics for the structural change of HbI during the transition from I0 to I1. The left panel shows the contraction of the protein. The volumes of I0, I0D, and I1 are indicated with red, green, and purple dashed lines, respectively. The volume of HbI after volume change is indicated by gray mesh. The right panel shows the movement of the C helix and the CD loop toward the center of the protein (magenta arrow) and the contraction of the heme–heme distance (green arrows) during the transition to I1. In d, g, exaggerated volume changes are shown for clarity.

