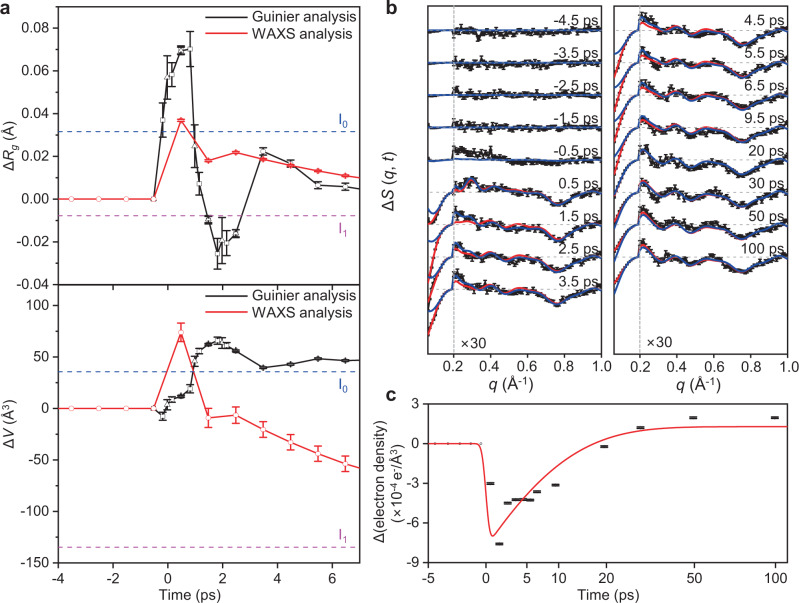
Fig. 4. Analysis of TRXSS data of HbI in the SAXS region using the Guinier analysis and the temporal change of the electron density in the hydration shell.
a Time profiles of the radius of gyration change (ΔRg) and volume change (ΔV) with respect to the carboxy structure in the early time domain (<7 ps) after photoexcitation obtained from the Guinier analysis on the SAXS region (black) and WAXS analysis (red). For the Guinier analysis results, the results from the 333-fs-binned data, 500-fs-binned data, and 1-ps-binned data are plotted with square, triangle, and circle, respectively. The Rgs and volumes of I0 and I1 are marked with blue and magenta dashed lines, respectively. For the Guinier analysis results, the error bars represent the fitting errors. For the WAXS analysis results, error bars represent SEM. b The experimental femtosecond TRXSS data and its SEM (black), the calculated difference scattering curves after fitting the electron density of the hydration shell (red), and the calculated difference scattering curves before the fitting (blue) from −4.5 to 100 ps. For clarity, the high q region with q ≥ 0.2 Å−1 is scaled up by 30. c The change of electron density of the hydration shell as a function of time (black) and an exponential decay function with a time constant of 8.7 ps (red).

