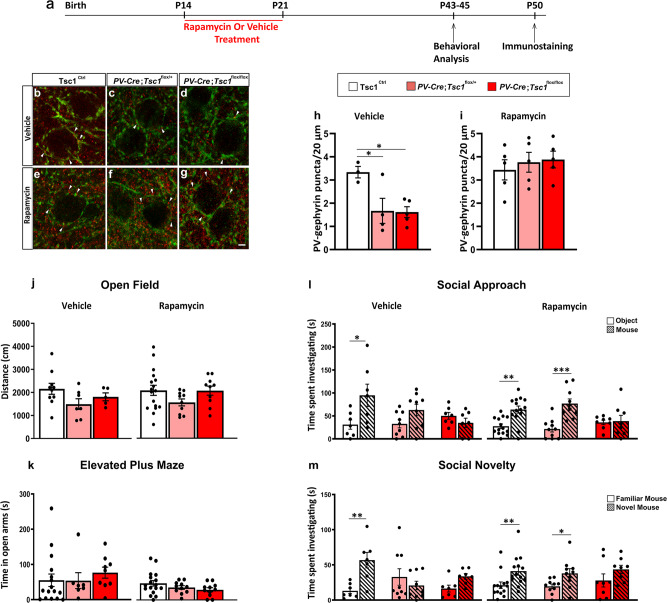
Fig. 10. Short term rapamycin treatment rescues loss of PV cell connectivity and social behavior deficits in adult heterozygous mutant mice.
a Schematic for treatment paradigm. b–g Representative immunostained sections of somatosensory cortex labeled for PV (green) and gephyrin (red) in Vehicle (b–d) and Rapamycin (e–g) treated mice showing PV-Gephyrin colocalized boutons (arrowheads). h PV-Gephyrin colocalized puncta in Vehicle (one-way Anova, *p = 0.036; Tukey’s multiple comparisons test: Tsc1Ctrl vs PV-Cre; Tsc1flox/+ *p = 0.0401; Tsc1Ctrl vs PV-Cre; Tsc1flox/flox *p = 0.0281, PV-Cre; Tsc1flox/+ vs PV-Cre;Tsc1flox/flox *p = 0.9942) and i Rapamycin treated mice (one-way Anova, p = 0.7355; Tukey’s multiple comparisons test: Tsc1Ctrl vs PV-Cre;Tsc1flox/+ p = 0.8421; Tsc1Ctrl vs PV-Cre; Tsc1flox/flox p = 0.7298, PV-Cre; Tsc1flox/+ vs PV-Cre; Tsc1flox/flox p = 0.9774). Number of vehicle-treated mice: Tsc1Ctrl, n = 3; PV-Cre; Tsc1flox/+, n = 4; PV-Cre; Tsc1flox/flox, n = 5. Number of rapamycin treated mice: n = 5 for all the genotypes. j Open field test. Vehicle-treated mice: Tsc1Ctrl, n = 10; PV-Cre;Tsc1flox/+, n = 7; PV-Cre;Tsc1flox/flox, n = 5. Rapamycin-treated mice: Tsc1Ctrl, n = 17; PV-Cre;Tsc1flox/+, n = 10; PV-Cre;Tsc1flox/flox, n = 10. k Elevated plus maze test. Vehicle-treated mice: Tsc1Ctrl, n = 16; PV-Cre; Tsc1flox/+, n = 7; PV-Cre;Tsc1flox/flox, n = 9; Rapamycin-treated mice: Tsc1Ctrl, n = 17; PV-Cre;Tsc1flox/+, n = 11; PV-Cre;Tsc1flox/flox, n = 11. l, m Rapamycin treatment from P14-21 rescues social approach (l, two-way ANOVA vehicle, Fgenotype (2, 20) = 1.615 p = 0.2238, Ftime (1, 20) = 4.789 p = 0.0407, Fgenotype*time (2, 20) = 3.395 p = 0.0538; *p = 0.0230, Holm–Sidak’s multiple comparisons test. Two-way ANOVA rapamycin, Fgenotype (2, 29) = 1.027 p = 0.3709, Ftime (1, 29) = 22.08 p < 0.0001, Fgenotype*time (2, 29) = 4.580 p = 0.0187; **p = 0.0019, ***p = 0.0002, Holm-Sidak’s multiple comparisons test) and social novelty deficits (m, two-way ANOVA vehicle, Fgenotype (2, 20) = 0.8281 p = 0.4513, Ftime (1, 20) = 5.876 p = 0.0250, Fgenotype*time (2, 20) = 6.036 p = 0.0089; **p = 0.0053, Holm–Sidak’s multiple comparisons test. Two-way ANOVA rapamycin, Fgenotype (2, 29) = 0.4667 p = 0.6317, Ftime (1, 29) = 18.84 p = 0.0002, Fgenotype*time (2, 29) = 0.09351 p = 0.9110; **p = 0.0081, *p = 0.0336, Holm–Sidak’s multiple comparisons test) in PV-Cre; Tsc1flox/+, but not in PV-Cre;Tsc1flox/flox mice. Vehicle-treated mice: Tsc1Ctrl, n = 7; PV-Cre; Tsc1flox/+, n = 9; PV-Cre;Tsc1flox/flox, n = 7. Rapamycin-treated mice: Tsc1Ctrl, n = 14; PV-Cre;Tsc1flox/+, n = 10; PV-Cre;Tsc1flox/flox, n = 8. Scale bar: 5 µm. Data represent mean ± SEM. Source data are provided as a Source Data file.

