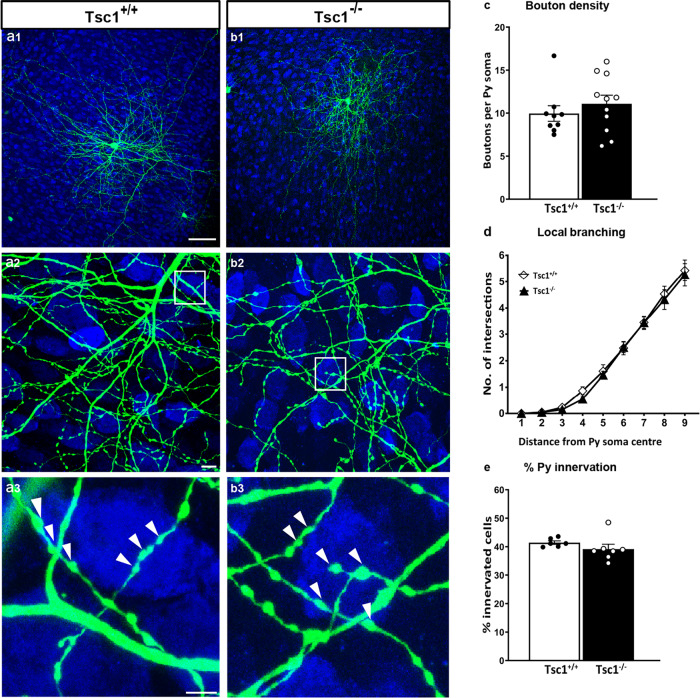
Fig. 7. Late-onset Tsc1 deletion in PV cells does not affect their innervation.
a1 EP 34 Tsc1+/+ and b1 Tsc1−/− PV cells show similar axonal branching (a2, b2) and perisomatic boutons (a3, b3, arrowheads). c Bouton density (Welch’s t-test, p = 0.4091; PV cells: n = 9 Tsc1+/+, n = 11 Tsc1−/−), d local branching (Welch’s t-test, p = 0.5789; PV cells: n = 9 Tsc1+/+, n = 11 Tsc1−/−), and e percentage of innervation (Welch’s t-test, p = 0.2448; PV cells: n = 6 Tsc1+/+, n = 7 Tsc1−/−) are not significantly different between the two groups. Scale bars: a1–b1, 50 µm; a2–b2, 10 µm, and a3–b3, 5 µm. Data in represent mean ± SEM. Source data are provided as a Source Data file.

