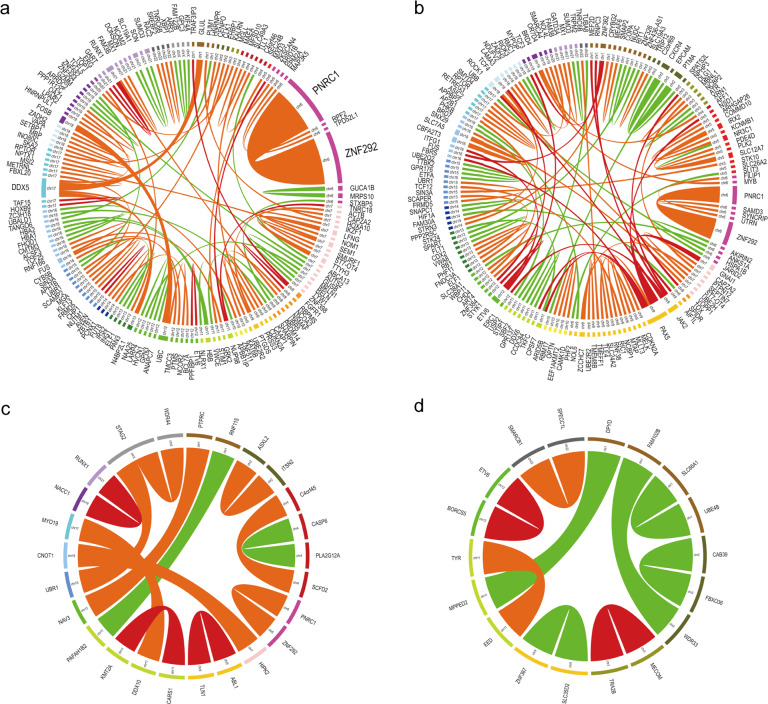
Fig. 6. Novel fusion genes detected in AML, B-ALL, T-ALL, and T-ALL.
The plot was generated by Circos. The outside circle indicates the chromosomal location of the unique fusion genes. The arcs indicate novel fusions in AML (a), B-ALL (b), T-ALL (c), and MPAL (d). The width of the connecting arcs reflects the recurrence of the fusion genes. Different colors of the ribbons indicate tier A (red), tier B (orange), and tier C (green) fusion genes.

