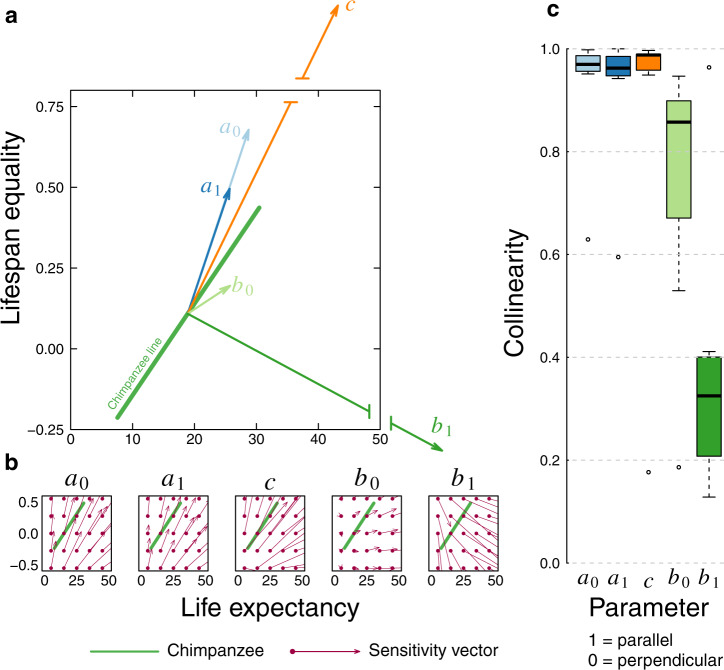
Fig. 2. Sensitivities of life expectancy and lifespan equality to changes in mortality parameters.
a Using the female chimpanzee line (bright green) as an example, vectors depict the sensitivity at the mid-point of the genus line. Each vector depicts the direction and magnitude of change in life expectancy and lifespan equality for a unit change in the corresponding Siler mortality parameter. The x- and y-axes show the life expectancy and lifespan equality values of the sensitivity vectors for a0 (light blue), a1 (dark blue), and b0 (light green); vectors for c (orange) and b1 (dark green) are particularly large, represented by broken lines (Source data are provided as a Source Data File and available in Supplementary Table 2). b Gradient field of sensitivities of life expectancy and lifespan equality to changes in each mortality parameter, showing the direction of change any population would experience for a given change in the parameter, from any starting point in the landscape. The green chimpanzee line is provided for reference. Each sensitivity vector (bright purple) can be interpreted as those in A, but calculated from different points on the landscape). c Boxplots representing the values of the seven collinearity values (one for each genus) for each of the Siler parameters for n = 7 independent genera. Collinearity is calculated between the mid-point of the genus line and the sensitivity vector for each parameter; a value of 1 would imply that the vector is parallel, a value of 0 would imply that it is perpendicular. Note the relatively large collinearity values for a0 (light blue), a1 (dark blue), and c (orange), the intermediate value for b0 (light green) and the relatively small value for b1 (dark green). The boxplots indicate median (horizontal black line), 25th and 75th percentiles (box), the whiskers are extend to 1.5 the interquartile range, and the open points are extreme values (Source data are provided as a Source Data File and available in Supplementary Table 3).

