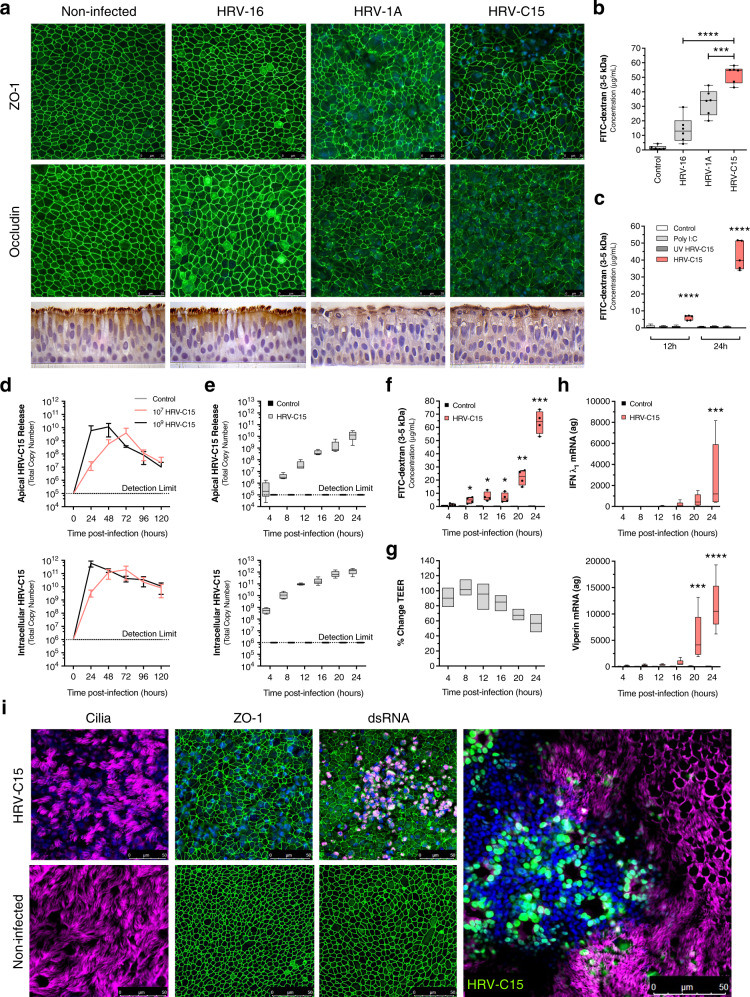
Fig. 1. HRV-C drives epithelial barrier loss in air–liquid interface cultures.
a, Top: representative immunofluorescence images of HRV strain comparison of ZO-1 and occludin (green) and DAPI (blue) at 24 h post infection. Representative confocal images were obtained from four independent experiments performed using ALI cultures derived from four different lung donors and selected from ten fields per condition per donor. Scale bar, 25 μm. Bottom: representative histological sections of HRV strain comparison. Representative histological section images using a ×100 objective were obtained from four independent experiments performed using ALI cultures derived from four different lung donors and selected from ten fields per condition per donor, n = 4 donors. b Permeability assay measuring apical to basolateral FITC-dextran (3–5 kDa) flux at 24 h post infection with either HRV-16, HRV-1A, or HRV-C15 in ALI cultures. Data were analyzed by one-way ANOVA with Holm–Sidak multiple comparisons: ***p = 0.0002, ****p < 0.0001, n = 6 donors. c Permeability assay measuring FITC-dextran (3–5 kDa) flux at 12 and 24 h post exposure to live HRV-C15, poly I:C (30 μg/mL), or UV-treated HRV-C15. Data are represented as boxplots and analyzed by one-way ANOVA with Dunnett multiple comparisons to noninfected ALI cultures at each time point: ****p < 0.0001, n = 5 donors. d HRV-C15 replication kinetics in ALI cultures (107 and 109 RNA copy number input dose) determined by serial apical DPBS washes (top) and intracellular lysates (bottom) collected at 24 h intervals for 5 days. There was no detectable HRV-C15 in noninfected ALI cultures. Dashed line represents RT-PCR detection limit. Data are represented as mean ± SD, n = 3 donors. e HRV-C15 replication kinetics in ALI cultures (109 RNA copy number input dose) determined by cumulative DPBS washes (top) and intracellular lysates (bottom) collected at 4 h intervals for 24 h. There was no detectable HRV-C15 in noninfected ALI cultures. Dashed line represents RT-PCR detection limit. Data are represented as boxplots, n = 5 donors. f FITC-dextran (3–5 kDa) flux in HRV-C15-infected ALI cultures during 24 h. Data are represented as boxplots in one figure for optimal visualization and analyzed by two-tailed paired t test to matched timepoint noninfected controls, from left to right: *p = 0.034, *p = 0.027, *p = 0.040, **p = 0.005, ***p = 0.0007, n = 4 donors. g Transepithelial electrical resistance (TEER) serially measured during HRV-C15 infection of ALI cultures over 24 h. Data are represented as minimum to maximum floating bars indicating mean (center line) of percent change of matched timepoint noninfected ALI cultures, n = 3 donors. h IFN-λ1 (top) and viperin (bottom) mRNA expression during HRV-C15 infection in ALI cultures over 24 h, quantified by RT-PCR. There were no detectable levels of IFN-λ1 or viperin in noninfected ALI cultures. Data are represented as boxplots and analyzed by one-way ANOVA with Dunnett multiple comparisons: IFN-λ1 ***p = 0.0003, viperin ***p = 0.0002, ****p < 0.0001, n = 5 donors. i Representative immunofluorescence images of HRV-C15-infected ALI cultures at 24 h post infection indicating ZO-1 (green), cilia (pink), DAPI (blue), and dsRNA (pink), n = 3. Merged representative image (far right) represents HRV-C15 localization in the ALI epithelium: cilia (pink), DAPI (blue), and dsRNA (green). Representative confocal images were obtained from three independent experiments performed using ALI cultures derived from three different lung donors and selected from ten fields per condition per donor. Scale bar, 50 μm. Data represented as boxplots indicate the median (center line), upper and lower box bounds (IQR = first and third quartiles), and whiskers (min and max values), with individual donor data points superimposed onto the boxplot.

