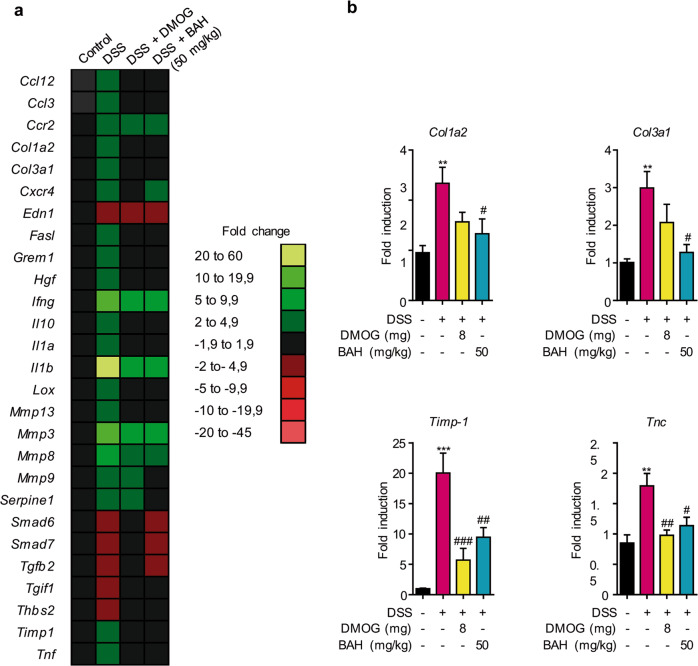
Fig. 7. BAH treatment normalized the expression of genes associated with fibrosis in the DSS model.
a RNA from colon tissue was used to determine the expression of genes involved in fibrosis by PCR array. Heat maps showed the significantly upregulated (green) or downregulated (red) genes in DSS + vehicle, DSS + BAH or DSS + DMOG compared with control + vehicle. b The mRNA expression of fibrosis-related genes (Col1a2, Col3a1, Timp-1, and Tnc) was quantified by qPCR and normalized to levels of Gapdh. Data represent the mean ± SEM, and significance was determined by one-way ANOVA followed by Tukey’s post hoc test. **P < 0.01, and ***P < 0.001 for DSS + vehicle vs control + vehicle; #P < 0.05, ##P < 0.01, and ###P < 0.001 for DSS + BAH or DSS + DMOG vs DSS + vehicle.

