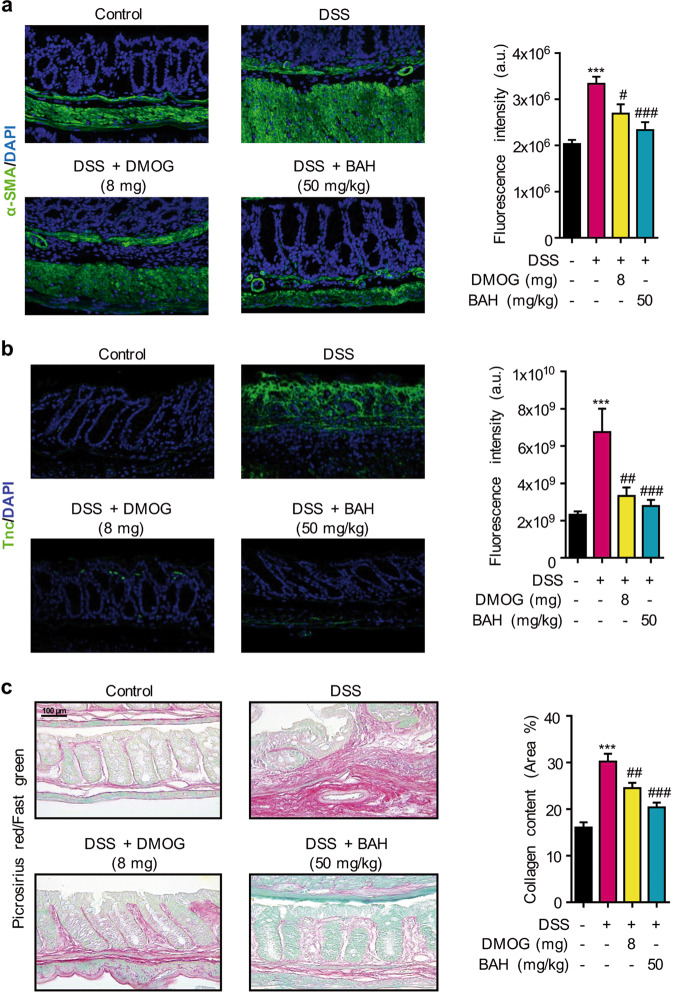
Fig. 8. BAH prevents colon fibrosis in the DSS model.
a Representative confocal microscopy images of smooth muscle cells (α-SMA, green fluorescence) in colon sections and their quantification. b Immunofluorescence labeling of TNC (green fluorescence) in the control, DSS + vehicle, DSS + DMOG and DSS + BAH groups is shown. c Representative images of Picrosirius Red/Fast Green staining (left panel). Comparison of the collagen content among the experimental groups (right panel). The original magnification of all images is ×20. The quantification is shown as the mean ± SEM (n = 6–8 animals per group), and significance was determined by one-way ANOVA followed by Tukey’s post hoc test. ***P < 0.001 for DSS + vehicle vs control + vehicle; #P < 0.05, ##P < 0.01, and ###P < 0.001 for DSS + BAH or DSS + DMOG vs DSS + vehicle.

