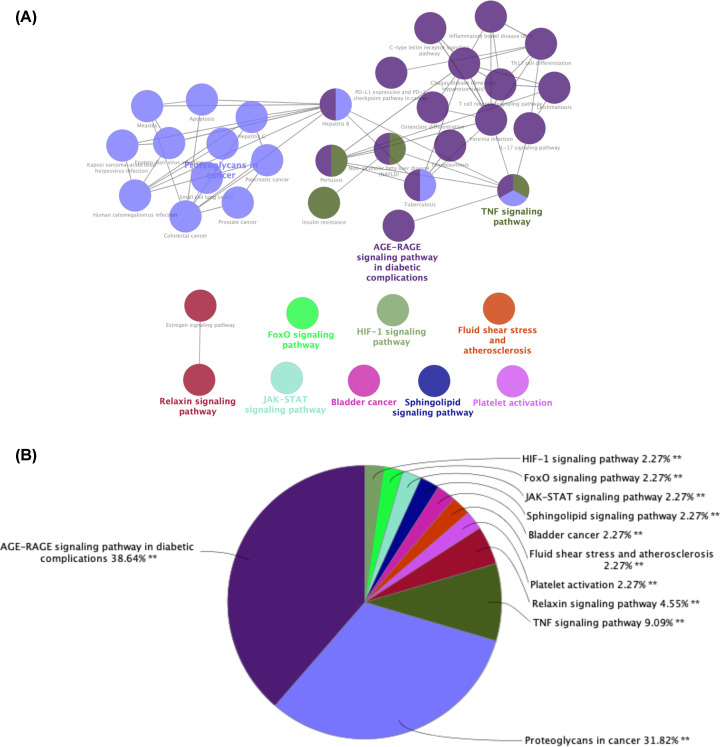
Figure 6. KEGG pathway analysis of potential targets of SM among DN-related proteins using the ClueGO plug-in.
(A) The KEGG term is indicated as a node, and the size of the node indicates its importance. Only the most significant terms in the group are labeled. (B) Pie chart presenting the percentage of genes involved in different biological functions and signaling pathways in the total number of genes that are intersected.

