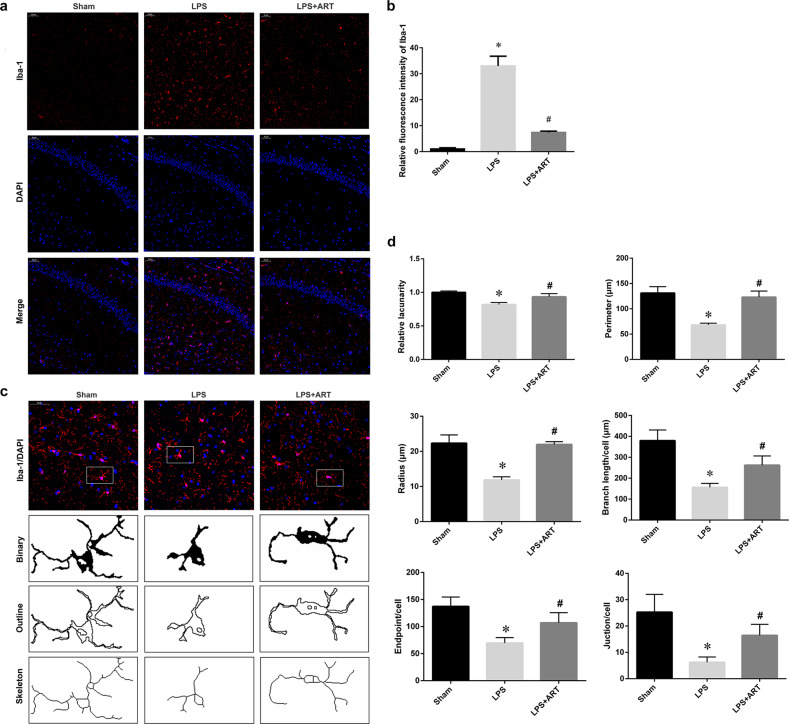
Fig. 3. Artemisinin attenuated LPS-induced microglial activation in the hippocampus.
a Immunofluorescence staining showing Iba-1-positive cells. Magnification: ×200. b Quantitative analysis of the data in a. c Iba-1 staining, binary, outline, and skeleton images of microglia. d Statistical analysis of microglial lacunarity, perimeter, radius, branches, endpoints, and junctions. *P < 0.05 versus sham group mice. #P < 0.05 versus LPS-treated mice. n = 6.

