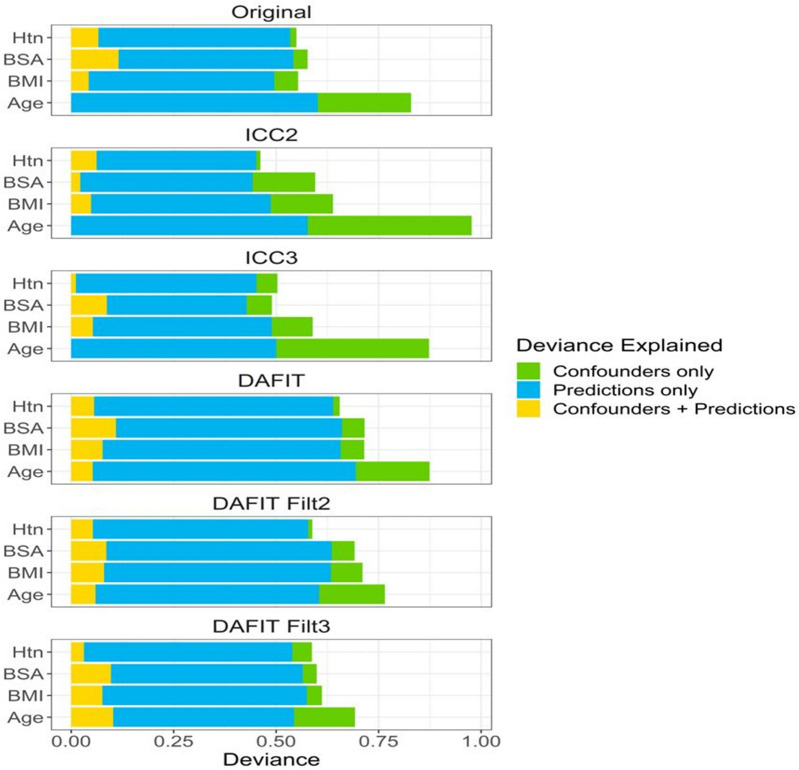
Figure 5.
Effect of confounding variables. This figure shows that of all the confounders evaluated, largest amount of deviance in the classifications is explained by age. Also, predictions by machine learning explain a large portion of the deviance that is not explained by the confounder variables. Htn hypertension, BMI body mass index, BSA body surface area, DAFIT—synthetic data creation using main and side study data; DAFIT Filt2—combining DAFIT with feature filtering from ICC2; DAFIT Filt3—combining DAFIT with feature filtering from ICC3.

