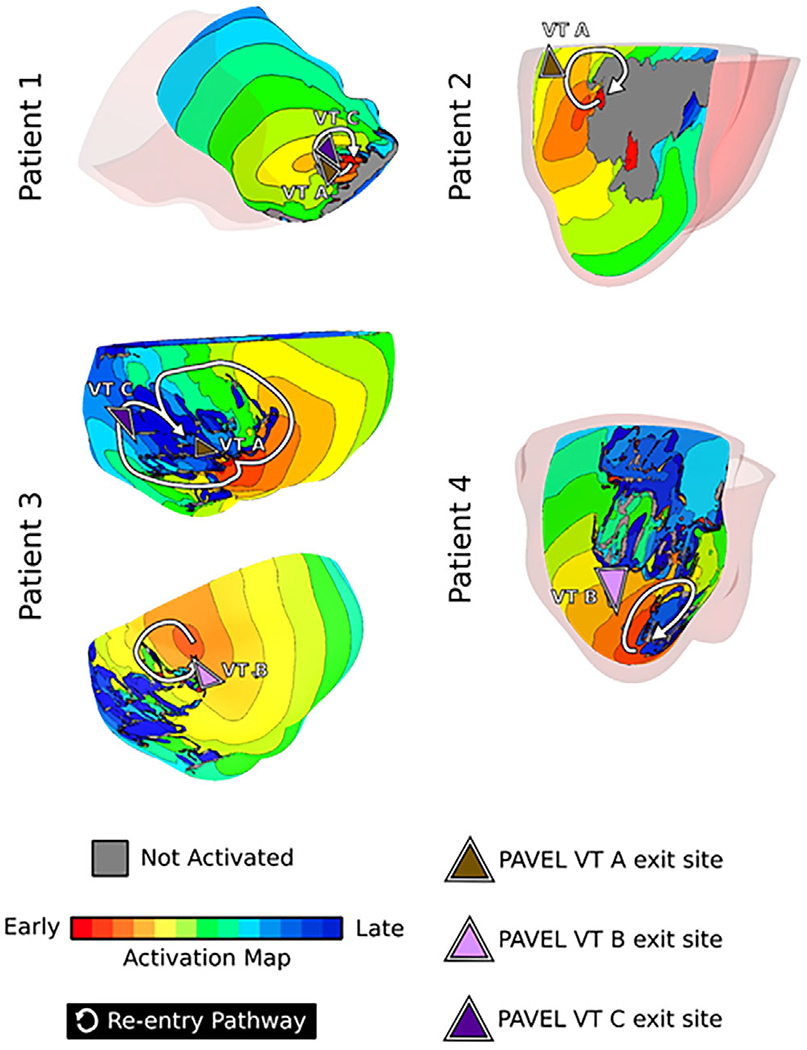
FIGURE 3.

Virtual-heart VT circuits correspond with PAVEL-predicted VT exit sites. Activation maps are shown for virtual-heart VT circuits that were proximal to PAVEL-VT exit site predictions. Brown, pink, and purple triangles denote the PAVEL-predicted VT A, B, and C exit sites, respectively; white arrows denote the re-entrant pathway
