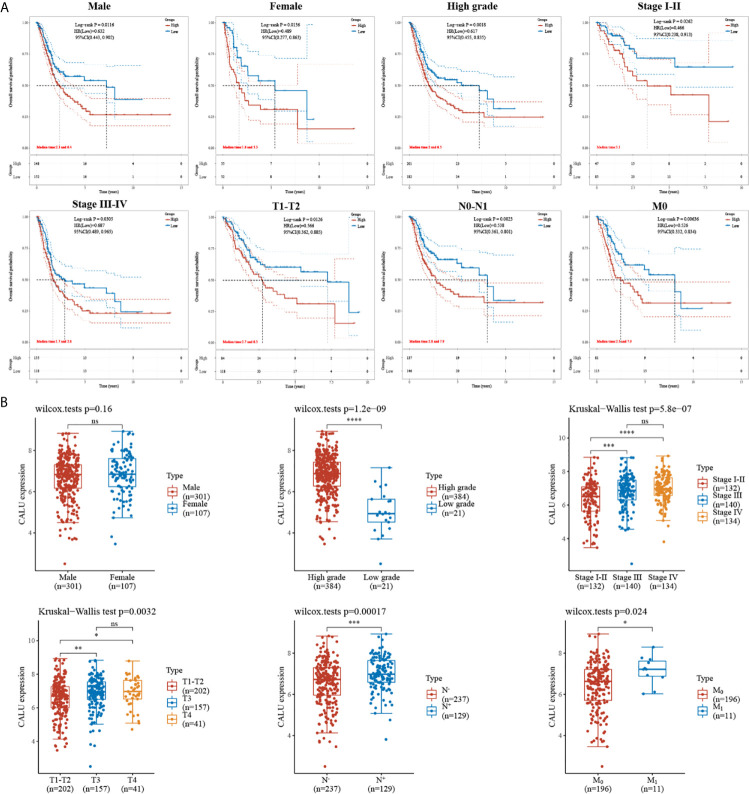
Figure 2.
Correlation of CALU with subgroup survival and clinical characteristics. (A) the expression level of CALU altered the OS of BLCA patients in multiple subgroups, including male (p=0.012), female (p=0.014), high grade (p=0.002), Stage I-II (p=0.026), Stage III-IV (p=0.031), T1-T2 (p=0.013), N0-N1 (p=0.002) and M0 (p=0.006). (B) Tumor tissue with higher grade (p<0.001), stage(p<0.001), T (p=0.003), N (p<0.001),M (p=0.024) classification expressed higher CALU. ****p<0.0001, ***p<0.001, **p<0.01, *p<0.05. NS, not significant.

