
Figure 2.
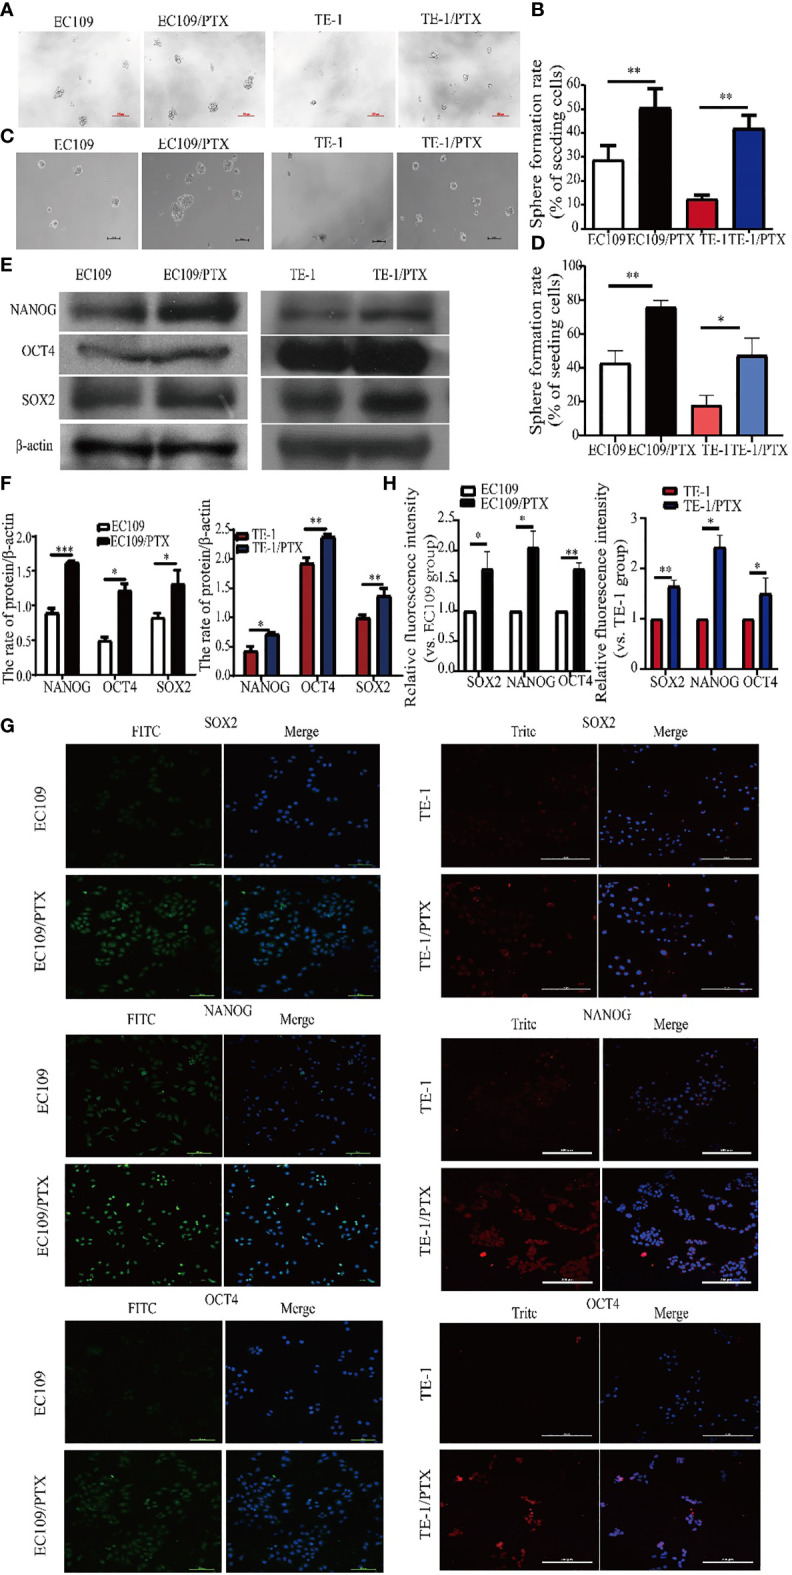
Enhanced cancer cell stemness in the drug-resistant cells. (A, B) Sphere formation assay on the two groups of cells and the corresponding statistical results. Scale bar: 100 µm. (C, D) LDA-Sphere formation assay on the two groups of cells and the corresponding statistical results. Scale bar: 100 µm. (E, F) Western blotting on the stem cell protein biomarkers and the corresponding statistical results. (G, H) Immunofluorescence analysis detected the expression of stem cell protein biomarkers NANOG, OCT4 and SOX2 in the two groups of cells. Scale bar: 100 µm (TE-1, TE-1/PTX), 200 µm (EC109, EC109/PTX). *P < 0.05 indicates statistically significance vs. parental cells. **P < 0.01 indicates highly statistically significant vs. parental cells.