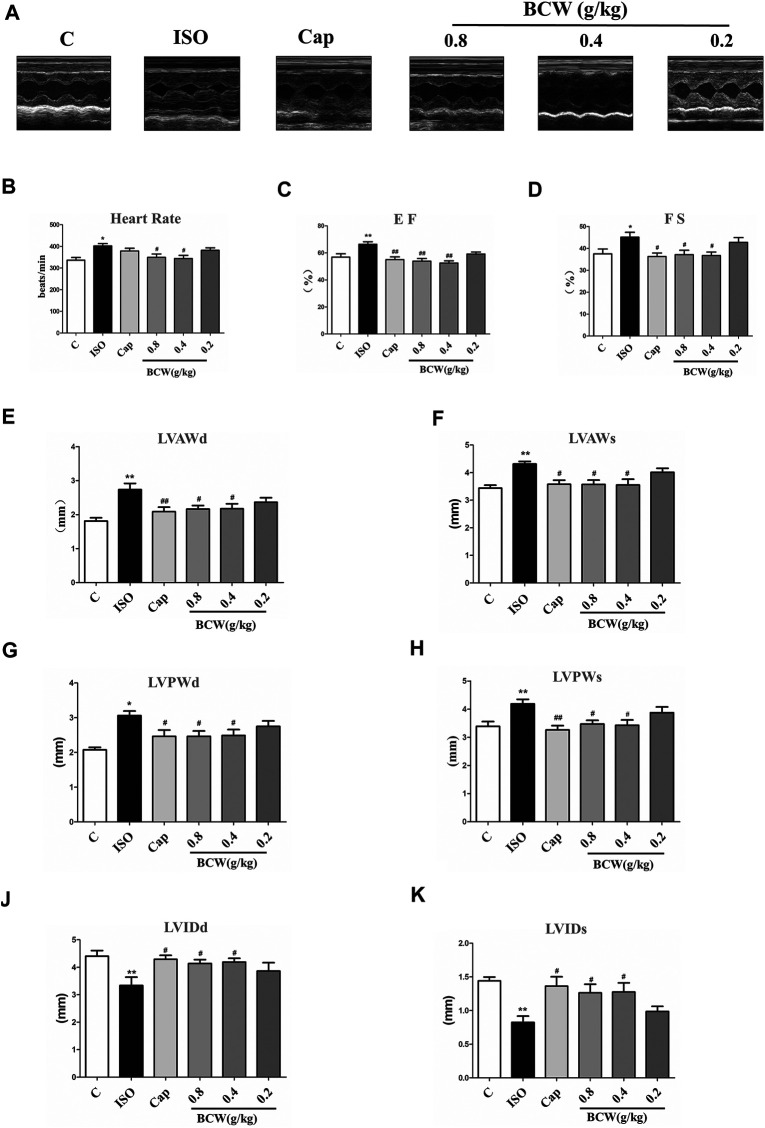
FIGURE 3.
BCW attenuated ISO-induced cardiac functional remodeling. (A) Representative M-mode tracings of echocardiography after 5 weeks of the whole experiments. (B–K) Quantification echocardiographic parameters: (B) heart rate (HR); (C) ejection fraction (E,F); (D) fractional shortening (FS); (E) left ventricular anterior wall at diastole (LVAWd); (F) left ventricular anterior wall at systole (LVAWs); (G) left ventricular posterior wall thickness at diastole (LVPWd); (H) left ventricular posterior wall thickness at systole (LVPWs) (I) left ventricular internal dimension at diastole (LVIDd); and (J) left ventricular internal dimension at systole (LVIDds); the data were expressed as the mean ± SE. *p < 0.05 vs. control, **p < 0.01 vs. control; # p < 0.05 vs. ISO, ## p < 0.01 vs. ISO, n = 10 in each group.

