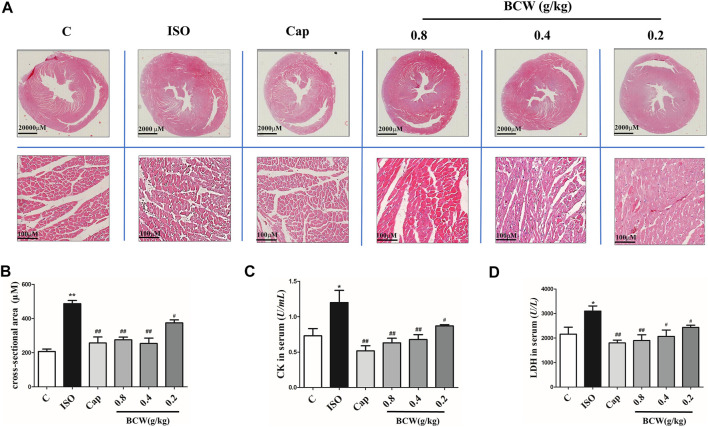
FIGURE 4.
BCW suppressed myocardial hypertrophy induced by ISO. (A) Representative slides of cardiac cross sections by hematoxylin and eosin; scale bar in A = 2000 μM, magnification (10×), scale bar in B = 100 μM, magnification (200×). (B) cross-sectional area (CSA) of cardiomyocytes, (C and D) The levels of CK and LDH in serum were measured by commercial kit, respectively. Results are shown as the mean ± SE. *p < 0.05 vs. control, **p < 0.01 vs. control; # p < 0.05 vs. ISO,## p < 0.01 vs. ISO, n = 10 in each group.

