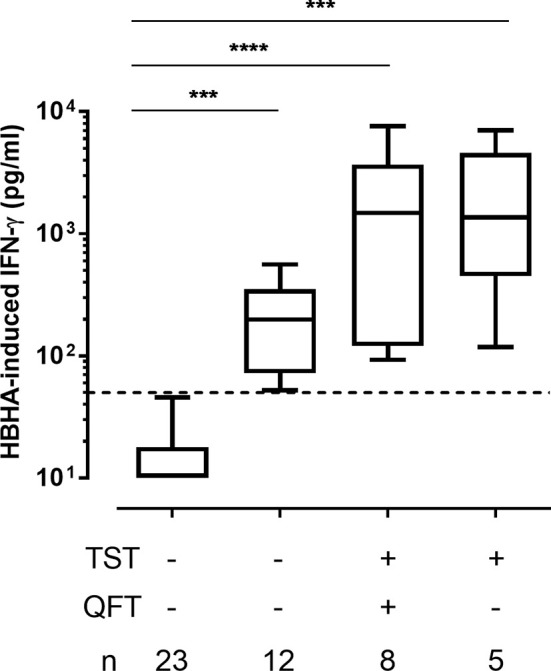
Figure 3.

HBHA-induced- IFN-γ concentrations. IFN-γ concentrations were measured in 24 h culture supernatants of PBMC incubated with HBHA. Patients were subdivided into 4 groups according to their TST and QFT status. Boxplots represent medians and interquartile ranges (25th-75th), with whiskers (min-max). Dotted lines indicate the positivity cut-off for HBHA-IGRA. ***p ≤ 0.001; ****p ≤ 0.0001.
