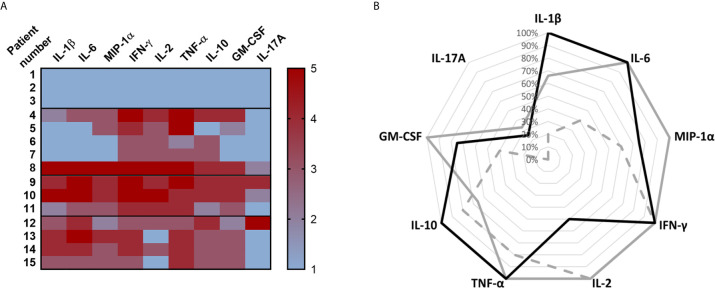
Figure 5.
HBHA-induced cytokine/chemokine profiles. PBMC from 3 different groups of patients were in vitro stimulated with HBHA during 24 h and cytokines/chemokines were measured in the culture supernatants using a multiparameter based immunoassay. (A) Heat-map of the HBHA-induced cytokine/chemokine secretions. Three TST− patients (patient n°1 to 3) were included in parallel to 5 TST+ QFT+ patients (patient n°4 to 8), 3 TST+ QFT− patients (patient n°9 to 11) and 4 TST−QFT-but HBHA+ patients (patient n°12 to 15). A color scale representing the intensity of the cytokine/chemokine concentrations was established for each analyte from negative values (1, blue) to doubtful (2, pink), low and strong cytokine/chemokine concentrations (3 to 5, from light red to dark red). (B) Radar chart of the HBHA-induced cytokine/chemokine profiles indicating the percentages of patients within each group secreting IL-1β, IL-6, MIP-1α, IFN-γ, IL-2, TNF-α, IL-10, GM-CSF and IL-17A at concentrations higher that the upper limit of the grey zone around the defined cut-off value. TST+QFT+HBHA-IGRA+ patients are represented by the dotted line (n=5), TST+QFT−HBHA-IGRA+ patients are represented by the grey line (n=3), and TST−QFT−HBHA-IGRA+ patients are represented by the black line (n=4).

