FIGURE 1.
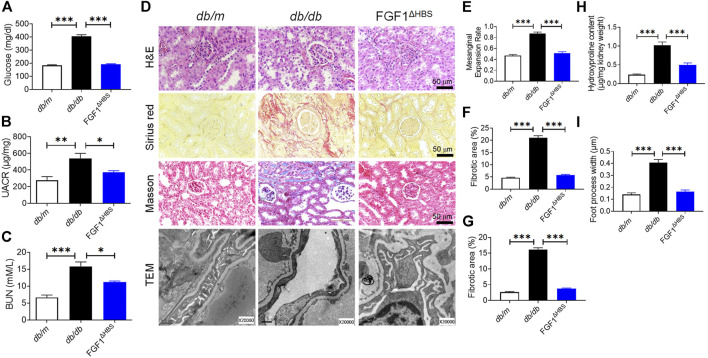
FGF1ΔHBS prevented renal remodeling and dysfunction in db/db mice. (A) Blood glucose levels. (B) Urine albumin-to-creatinine ratio (UACR). (C) Blood urea nitrogen (BUN) levels. (D) Representative images of hematoxylin and eosin (H&E) staining, Sirius red staining, Masson’s trichrome staining and transmission electron microscopy (TEM) images of renal tissues. (E) Quantification of mesangial expansion. (F) Quantification of the fibrotic area in Sirius red staining. (G) Quantification of the fibrotic area in Masson staining. (H) Hydroxyproline content in renal tissues. (I) Quantification of podocyte foot process effacement. Data are presented as the mean ± SEM (n = 6); *p < 0.05, **p < 0.01, ***p < 0.001.

