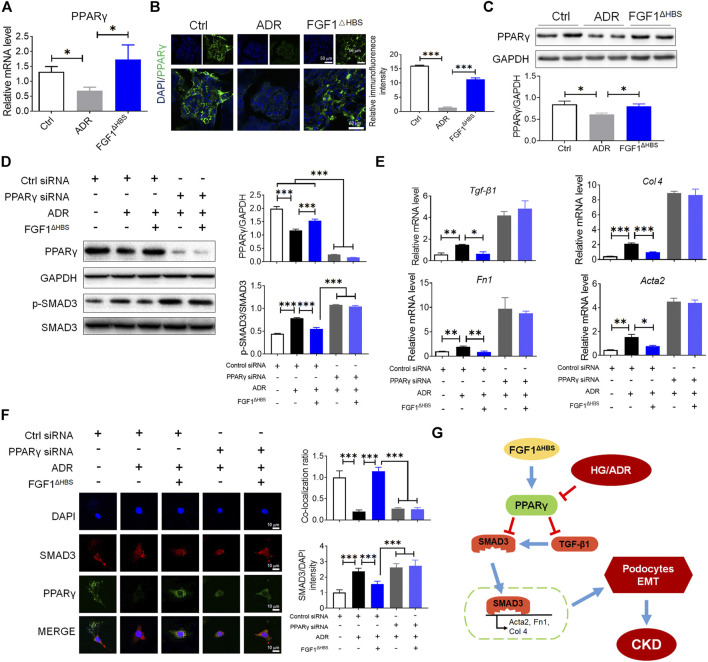
FIGURE 6.
FGF1ΔHBS suppressed podocytes EMT via upregulation of PPARγ under ADR challenge. (A) Real-time PCR analysis of PPARγ mRNA expression. (B) Representative images and quantitation of immunofluorescence staining for PPARγ. (C) Expression levels of PPARγ as determined by western blot analysis and quantitation using ImageJ. (D) Phosphorylation levels of SMAD3 and protein expressions of PPARγ as determined by western blot analysis and quantitation using ImageJ. (E) Real-time PCR analysis of TGF-β1, Fn1, Col 4, and Acta2 mRNA expression. (F) Representative images and quantitation of immunofluorescence staining of SMAD3 and PPARγ. (G) A mechanistic illustration of FGF1ΔHBS protection from diabetes or chemical induced podocyte EMT and CKD. In panels (A–C), Data are presented as the mean ± SEM (n = 6). In panels (D–F), data from three independent measurements are presented as the mean ± SEM; *p < 0.05, **p < 0.01, ***p < 0.001.

