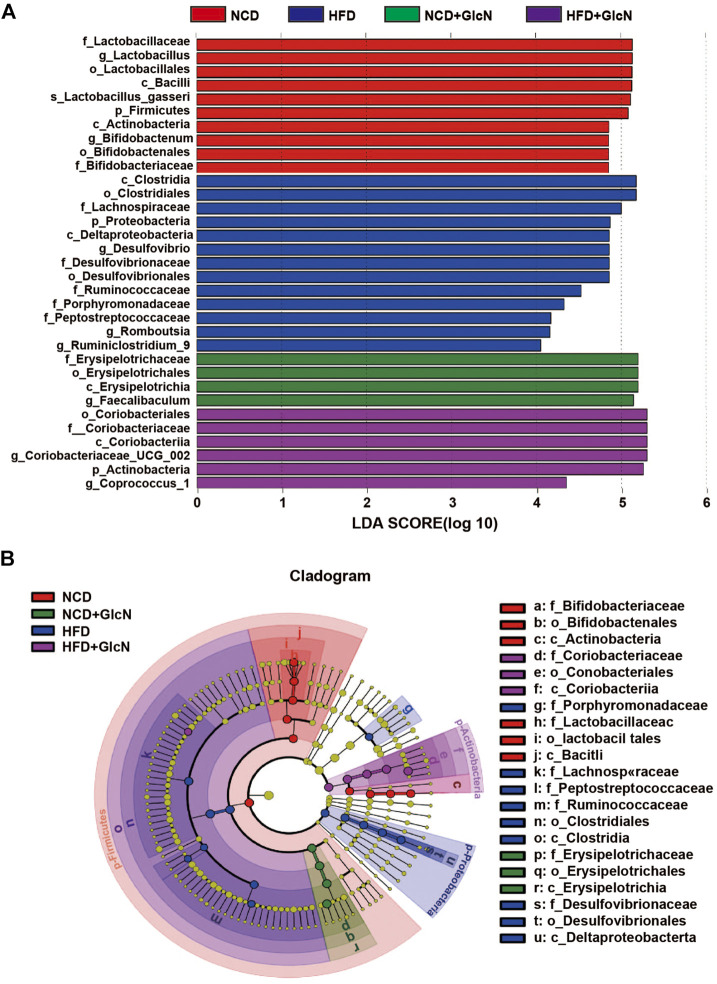
FIGURE 5.
Identification of most significantly contributed intestinal microbes among experimental groups using Linear discriminant analysis (LDA) and Linear discriminant analysis Effect Size (LEfSe). After the treatment with NCD, HFD, and/or GlcN (1 mg/ml, in drinking water) for 5 months, all mice were sacrificed and the cecal contents were collected for 16S rDNA sequencing. LEfSe analysis was performed based on the intestinal microbial abundances and compositions, and the results were displayed in the form of LDA value distribution histogram (A) and cladogram (B).

