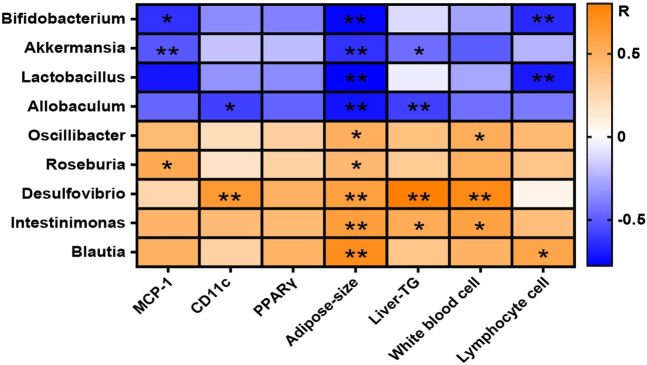
FIGURE 9.
Correlation between gut microbiota and physiochemical indices among experimental groups. After the treatment with NCD, HFD, and/or GlcN (1 mg/ml, in drinking water) for 5 months, all mice were sacrificed and the cecal contents were collected for 16S rDNA sequencing. The correlation between changed gut microbiota at the genus level and physiochemical indices was displayed in a heat map. The orange-white-blue grid corresponded to the R-value of 0.5-0-(−0.5). Orange color, positive correlation; blue color, negative correlation. Data were shown as means ± SEM (n = 5). *p < 0.05, **p < 0.01.

