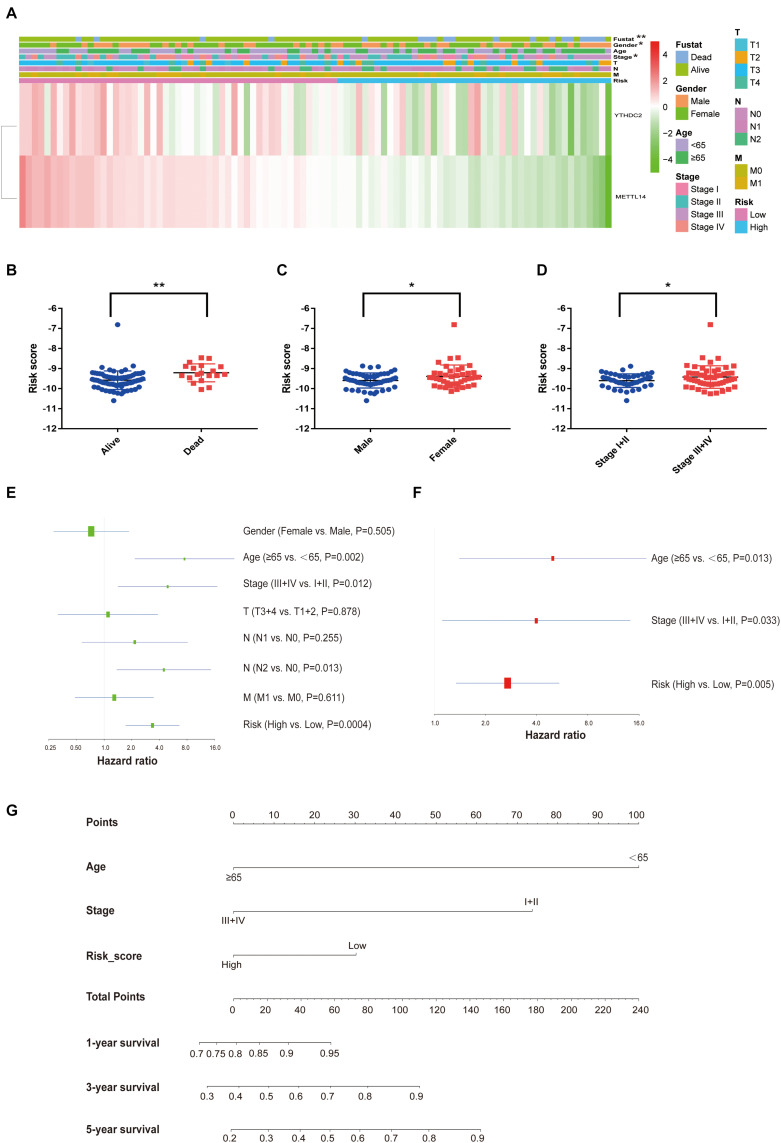
FIGURE 2.
Relation between the risk score and clinicopathological characteristics in rectal cancer. (A) The heatmap shows the expression of the two m6A regulator genes in the high-risk and low-risk rectal cancer. (B–D) The distribution of risk score in patients stratified by the live status (B), gender (C), and pathological stage (D) (unpaired T-tests). (E,F) The forest plot of univariate and multivariate Cox regression analysis. (G) The nomogram integrating risk score and clinicopathological factors in the prediction model. *P < 0.05, **P < 0.01.

