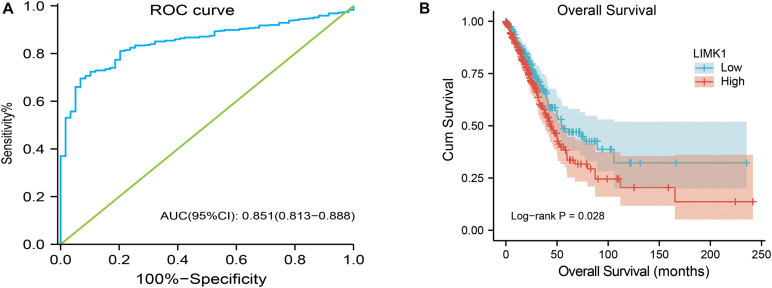
FIGURE 4.
ROC and Kaplan-Meier curves for LIMK1. (A) ROC curve showed that LIMK1 had an AUC value of 0.851 to discriminate lung adenocarcinoma tissues from healthy controls. With a cutoff of 4.908, the sensitivity, specificity and accuracy were 93.2, 71.9, and 69.5%, respectively. (B) Kaplan-Meier survival curves indicated that lung adenocarcinoma patients with high LIMK1 mRNA expression had a shorter OS than those with low-level of LIMK1 (43.1 vs. 55.1 months, P = 0.028).

