Figure 2.

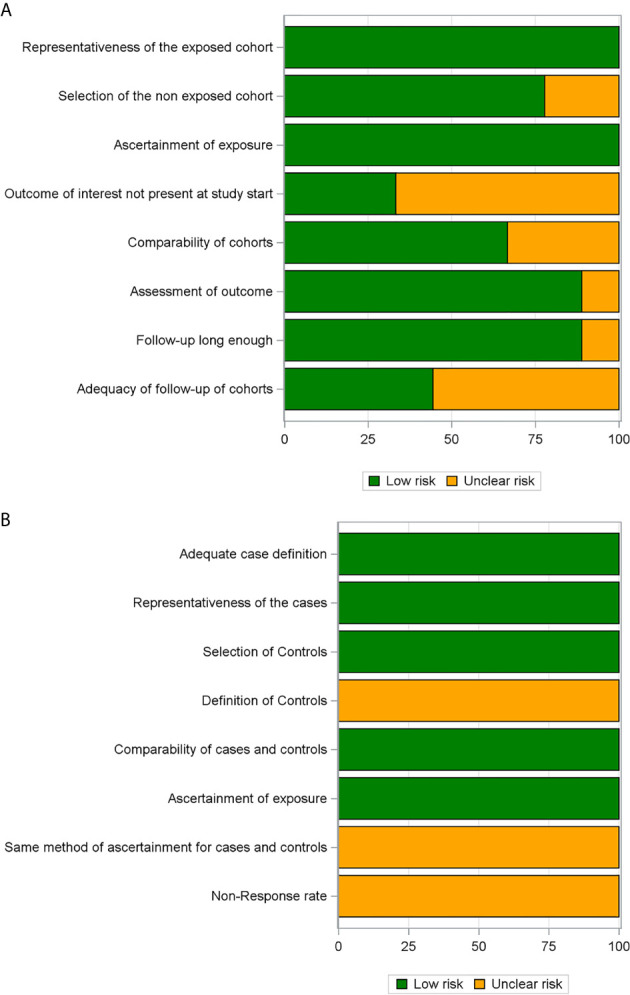
Risk of bias assessment through the Newcastle-Ottawa Scale presented as percentages across all included cohort studies (A) and case–control studies (B).

Risk of bias assessment through the Newcastle-Ottawa Scale presented as percentages across all included cohort studies (A) and case–control studies (B).